
Air Quality Index Between California Cities: Why Readings Differ
Compare AQI and PM2.5 levels across California cities. See how valley geography, traffic and density drive gaps, with IQAir 2019 data.
Compare cities and neighbourhoods before deciding where to live.
Komparons
Compare AQI and PM2.5 levels across California cities. See how valley geography, traffic and density drive gaps, with IQAir 2019 data.
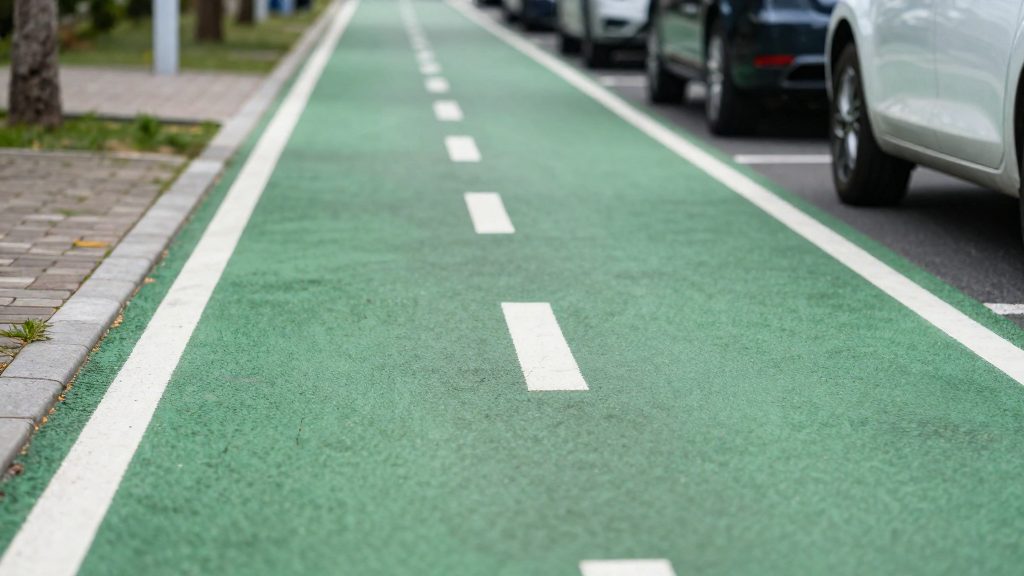
Compare US cities by Walk Score, Bike Score and bike infrastructure. See how Boulder, Minneapolis, Portland, San Francisco and Miami rate for getting around.
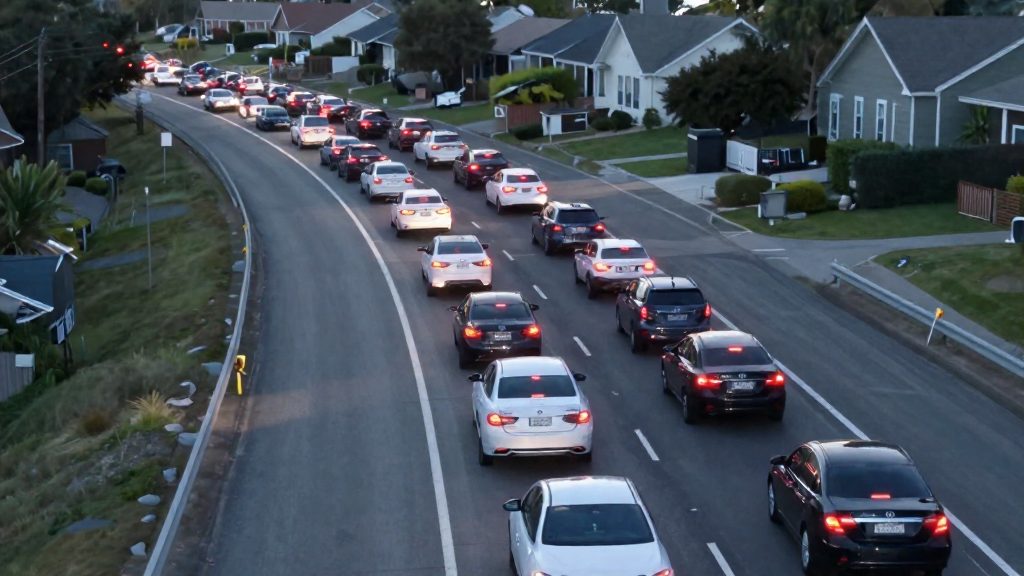
Compare mean car commute times across Atlanta suburbs, from Fulton's 28.9 minutes to Cherokee's 35.0, using 2020 ACS 5-year Census estimates.
Compare Ohio and Indiana cost of living with 2024 BEA Regional Price Parity data. Both states sit below the US average. See the gap and its caveats.

Single cost-of-living scores hide category weights and intra-metro gaps. Learn how to compare two US cities using BEA price parities and real salaries.

Chicago crime rates vary sharply by neighborhood. Compare poverty, nightlife density and housing vacancy as drivers of local offense patterns.

Learn how to compare licensed child care places against local demand by neighborhood, and spot child care deserts before you choose where to live.

Compare earthquake risk across California and Oregon cities: crustal faults versus Cascadia subduction, coastal shaking and tsunami exposure.
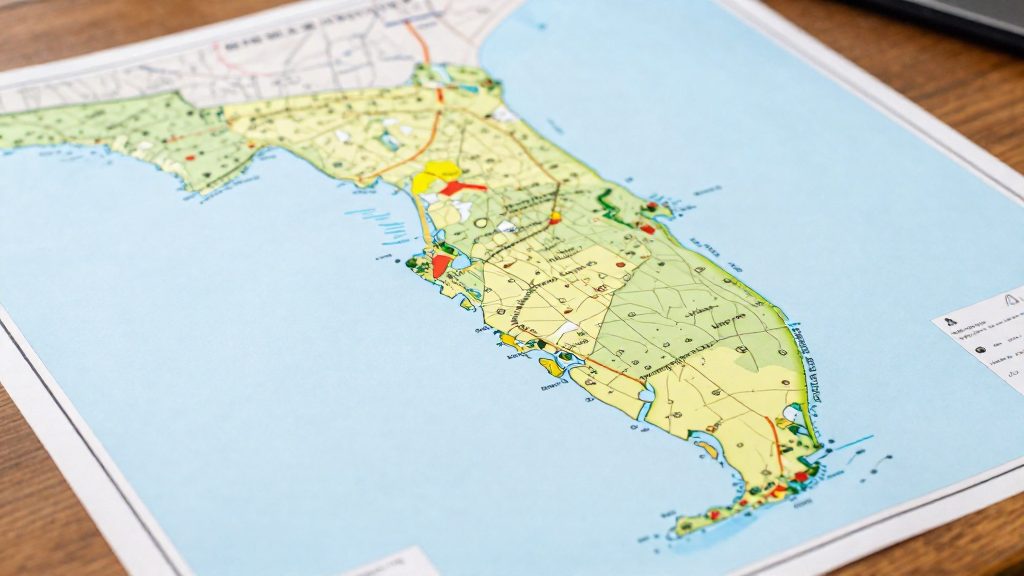
Find out why FEMA flood zones differ county to county in Florida, and how Volusia, Miami-Dade and Brevard rank for flood risk.