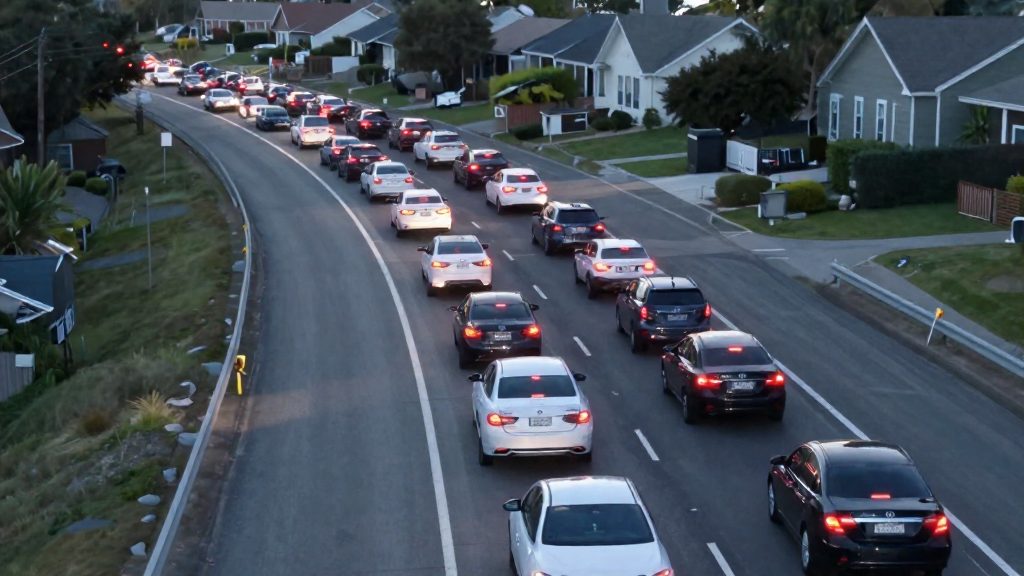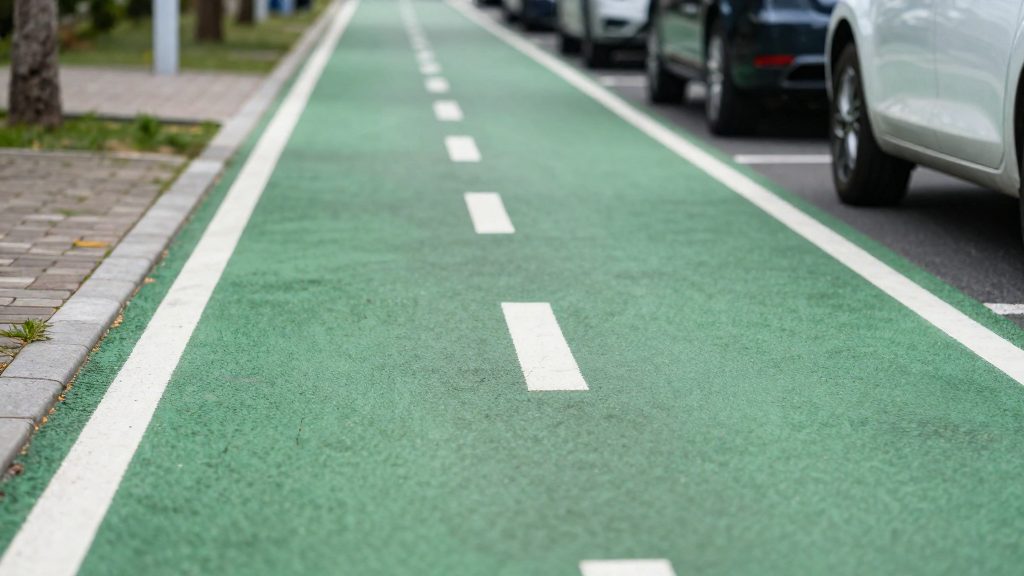
Walk Score and Bike Score are single numerical ratings that express how practical a location is for getting around on foot or by bike, rather than by car. According to Streetsblog San Francisco’s 2012 description, the Bike Score algorithm weighs three inputs: bike infrastructure, topography, and the number of cyclists on the streets. A higher number indicates a more favorable location. Reading the scores correctly depends on knowing these inputs, how the figures are scaled, and which dataset and year a given score comes from.
How do Walk Score and Bike Score work?
Bike Score inputs
- Bike infrastructure: the cycling facilities available in an area.
- Topography: the terrain, which affects how demanding a ride is.
- Cyclist counts: how many cyclists are present on the streets.
The three inputs are weighed together into one score. The published description does not state the individual weights, so the score should be read as a combined measure rather than as the sum of separate parts.
Walk Score inputs
The available data covers only the Bike Score method. For Walk Score, check the method Walk Score itself publishes before comparing cities, instead of assuming it uses the same inputs.
Reading the scale
Each score is a single figure where a higher number means a better location for that mode of travel. The 2012 citywide Bike Score list shows that the figure does not simply track city size, with Boulder at 86 and Minneapolis at 79, while Portland and San Francisco each reached 70.
Walk Score and Bike Score are separate scales. In Redfin’s 2020 analysis, Miami scored 78 for Walk and 60 for Bike, so a city can rate well for walking and less well for cycling.

Walkability: which US cities lead?
The most recent comparison in the source material is Redfin’s 2020 ranking of US cities with more than 300,000 residents. It combined Walk Score, Transit Score and Bike Score into one composite. Within that ranking, New York had the top Walk Score result, and San Francisco had the highest overall composite. Boston placed 3rd on all three scores, so it ranked high on each of the three measures.
Miami illustrates how walking and cycling scores can differ within one city. It scored 78 for Walk, against 60 for Bike, so its walking profile is considerably stronger than its cycling profile. The source does not give Walk Score figures for the other cities, so the full ordering of Walk Score values cannot be reconstructed from the material available.
Gaps between large and small cities cannot be measured from this data. The Redfin study covered only cities above 300,000 residents, so smaller cities were excluded by design. The small-city figures in the source (Boulder 86, Minneapolis 79) are Bike Score values from 2012, not Walk Score values, and they cannot be used to estimate a walkability gap.
To measure that gap yourself:
- Pull Walk Score values for a set of large and small cities from the same source and the same date.
- Compare the averages or medians of each group, and list the individual cities so outliers are visible.
- Record the population threshold used to define “large” so the comparison can be reproduced.
Which US cities had the highest Bike Scores in 2012?
The first citywide Bike Score list, published in 2012, is the first citywide Bike Score list. Boulder (86) and Minneapolis (79) led, while Portland and San Francisco tied at 70 as the top large cities.
| City | Bike Score (2012 list) |
|---|---|
| Boulder | 86 |
| Minneapolis | 79 |
| Portland | 70 |
| San Francisco | 70 |
| Boston | 68 |
| Philadelphia | 68 |
| Washington DC | 65 |
| New York | 62 |
| Chicago | 62 |
| Los Angeles | 54 |
| Houston | 49 |
Smaller cities scoring higher
Two smaller cities, Boulder (86) and Minneapolis (79), outscored every larger city in the table. Two data points are not enough to say how Bike Score relates to population size.
Large cities lagging
Los Angeles (54) and Houston (49) were the lowest-scoring cities among those shown in the table. Their gap from the top score of 86 is 32 and 37 points, respectively. Comparing these two cities with Portland or San Francisco (both 70) shows how much the score varies among large US metros.
How to use the 2012 figures
- Compare only scores from the same list and year. Within a shortlist of two or three cities, use the scores directly and do not rely on rank alone.
Why do bike rankings disagree?
Published city rankings often disagree because they measure different things. A single-metric list orders cities by one score, while a composite list merges several scores into one figure. Each list also decides which cities enter the comparison, and how the numbers are combined. Any of these choices can move a city up or down without any change to its streets.
Composite weighting
A composite score combines separate measures into one number, so the result depends on how much each measure counts. Redfin’s ranking combined Walk Score, Transit Score and Bike Score. The source does not state the weights Redfin applied, so the contribution of each score to the final order cannot be recalculated from the published list. Before comparing two composite rankings, check whether each one gives equal weight to walkability, transit and cycling, or favours one of them.
Population cutoffs
A population cutoff determines which cities are ranked at all. Redfin limited its ranking to US cities with more than 300,000 residents. The first citywide Bike Score list in 2012 included smaller cities. Two lists built on different cutoffs rank different pools of cities, so their positions cannot be compared directly.
Score versus rank
A score is an absolute value, while a rank is a position within a chosen group. A city can keep the same score and still change rank when the group changes. Redfin’s results illustrate the gap between the two:
| Measure (Redfin, 2020) | City | Result |
|---|---|---|
| Overall composite | San Francisco | Highest composite |
| Walk Score ranking | New York | Top ranking |
| Bike Score ranking | New York | 7th |
| Ranking on all three scores | Boston | 3rd |
| Walk Score / Bike Score | Miami | 78 / 60 |
New York leads on walkability but falls to 7th on cycling, which shows why a single overall rank can hide large differences between individual measures.

Do high scores raise housing prices?
A high Walk Score or Bike Score describes how easy it is to get around without a car. It does not directly measure what homes cost. Any link between the two is an observed correlation, and the fact sheet for this article contains no housing price figures, so no price premium can be quantified here. The method below explains how to test the question with your own data.
Correlation versus causation
Score-price comparisons often mix up two things:
- Correlation: high-score neighborhoods tend to have higher prices.
- Causation: the score itself pushes prices up.
Both can be true for reasons unrelated to the score. Dense, central areas usually score high on walkability, and they also tend to have older housing stock, more jobs nearby, higher incomes, and stronger school or service ratings. Any of these can drive prices. Before attributing a price gap to walkability, check whether the comparison holds these factors roughly constant, for example by comparing homes of similar size and age within the same district.
Public sales records for price comparison
To compare prices across neighborhoods, use recorded property sales rather than listing prices. Recorded sales show what buyers actually paid. Listing prices show what sellers asked.
Steps for a basic comparison:
- Collect sale records for the same time window in each neighborhood.
- Remove sales that are not arm’s-length transactions, such as transfers between relatives.
- Normalize by floor area so that large and small homes are comparable.
- Attach the Walk Score or Bike Score for each sale’s location.
- Compare the normalized price distributions across score bands.
Public records are typically maintained at the local government level, so coverage and field definitions vary by jurisdiction. Check what each source includes before combining them.
Score effects on neighborhood price premiums
A useful test is whether prices differ between two areas that are otherwise similar but have different scores. Pairs of adjacent neighborhoods separated by a boundary, such as a major road or a rail line, are a practical way to do this. If prices diverge sharply at the boundary while housing stock and incomes stay similar, the score may be one contributing factor. Other differences, such as noise, schools or safety, still have to be ruled out. If the gap disappears once housing characteristics are accounted for, the premium is likely explained by those characteristics instead.
How to compare cities and neighborhoods
Compare walkability and bikeability in three passes: check the publication date and source first, then set the neighborhood-level figure against the citywide average, and only then add transit and climate data. Skipping the first pass makes comparisons unreliable.
Neighborhood-level scores versus citywide averages
A citywide average smooths out internal differences. A city can post a strong overall figure while its outer districts are far less walkable or bikeable. Pull the score for the specific neighborhood you are considering, then compare it with the city figure. If the two are close, the city average is a reasonable proxy. If they differ widely, use the neighborhood score.
Keep both sides of a comparison at the same level. Set neighborhood against neighborhood, or city against city. A neighborhood score placed next to another city’s average is not a fair match.
Checking publication dates and data vintage
Every score carries a data vintage, the date it was published. The fact sheet gives two examples:
| Source | Publication date | Scope | Figures in the fact sheet |
|---|---|---|---|
| Streetsblog SF | 2012-12-18 | First citywide Bike Score list | Portland 70, San Francisco 70, Boston 68, Los Angeles 54, Houston 49, Boulder 86, Minneapolis 79 |
| Redfin | 2020-10-06 | US cities over 300,000 residents, composite of Walk, Transit and Bike Scores | San Francisco highest composite; New York top Walk Score, 7th Bike Score; Miami Walk 78, Bike 60 |
These sets come from different years and different methods, so do not read them as a single trend. Record the date beside every figure in your own comparison.
Combining walk and bike scores with transit and climate data
Walk and bike scores describe how easily residents can reach places on foot or by bike. They do not describe rail or bus service, and they do not describe weather. Treat each as a separate column rather than blending them into one number. The fact sheet shows why: New York led the Redfin Walk Score ranking but placed 7th on Bike Score, while Boston ranked 3rd on all three scores. Separate columns make such gaps visible.
Transit data answers whether a high walk score comes with practical service. Climate data answers whether cycling or walking is comfortable for most of the year. The fact sheet contains no climate figures, so take temperature and precipitation values from a public climate dataset covering the same area, and label the period those values describe.
Frequently asked questions
Does a high Bike Score mean a city has more bike lanes?
Not necessarily. Bike Score combines bike infrastructure, topography and the number of cyclists on the streets, so lane provision is only one of three inputs. The published description does not give the individual weights, so the score cannot be broken back into its parts.
Can I compare a city’s Walk Score and Bike Score directly?
Yes, but only as two separate readings, since they are scored on different scales and should not be added together. Redfin’s 2020 figures for Miami, 78 for Walk Score and 60 for Bike Score, show an 18-point gap within a single city.
Which year’s scores should I use when comparing cities?
Check the publication date and source of every figure before placing them in one table. The 2012 citywide Bike Score list and Redfin’s 2020 composite come from different publishers and measure different things, so their numbers are not directly interchangeable.