Air quality readings differ between California cities, and local factors such as valley geography, traffic and industrial emissions near urban cores, and population density near freeways are commonly cited as contributors. The sources used here show the size of the gap but do not measure how much each factor contributes. The gap is large. IQAir’s 2019 PM2.5 data put Yucca Valley at 3.4 μg/m³, while Portola reached 16.9 μg/m³, roughly five times higher. The sections below explain each mechanism and show where the figures reflect it.
Why AQI differs between California cities
Valley geography and trapped pollutants
Valleys act as basins. When air near the surface moves slowly, pollutants released at ground level stay in place longer, so local concentrations build up. The fact sheet does not quantify this effect for any single valley, but it matters most in the San Joaquin Valley. The San Joaquin Valley APCD is one of the five contributors to IQAir’s California data. Bakersfield, Fresno-Madera-Hanford and Visalia all appear in the American Lung Association list of worst US metros for annual PM2.5, as cited by IQAir in 2019. In IQAir’s live ranking opened on 2026-10-27, Bakersfield read 96 AQI, and Shafter and Delano read 118 and 124.
Traffic, ports and industrial emissions near urban cores
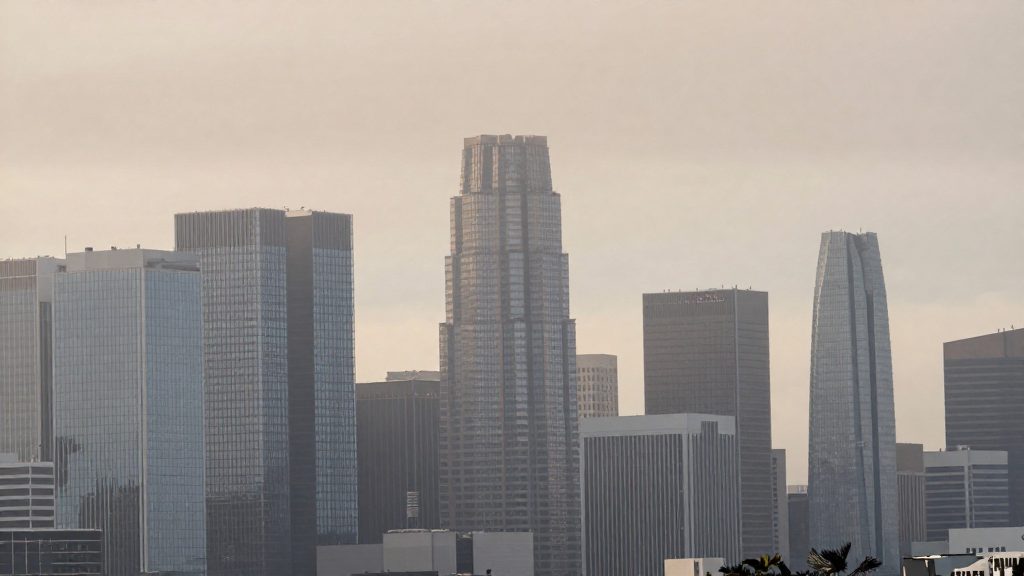
Vehicles, port operations and industrial sites release pollutants where people live and work, so readings near dense urban cores often exceed those of smaller, less built-up communities. The fact sheet does not give emission volumes by source, so the evidence here is comparative. Los Angeles-Long Beach and San Jose-San Francisco-Oakland both appear in the ALA list of worst US metros for annual PM2.5. Both are large urban metros with heavy traffic. However, the sources give no per-core comparison with rural communities, and small places such as Portola also appear among the most polluted cities, so urban size alone does not explain the ranking.
Population density and freeway proximity
Emissions alone do not determine exposure. Population density and distance from major freeways shape how many residents breathe polluted air. A household close to a heavily trafficked freeway may receive a higher exposure than one farther away, even within the same city. A city-wide AQI averages readings across neighbourhoods, so it can understate or overstate what a specific block experiences.
Statewide baseline and the single-moment problem
IQAir reports that California’s 112 cities averaged 12.1 μg/m³ of annual PM2.5 in 2018. Only 35.7% met the WHO annual target, compared with 81.7% nationally. The WHO target cited on the page is 10 μg/m³, which is the older guideline. WHO’s current (2021) annual PM2.5 guideline is stricter, at 5 μg/m³.
Live rankings are a different measure. The table below separates the two:
| City | Measure | Value | Date | Source |
|---|---|---|---|---|
| Delano | Live AQI | 124 | 2026-10-27 | IQAir |
| Timber Cove | Live AQI | 121 | 2026-10-27 | IQAir |
| Shafter | Live AQI | 118 | 2026-10-27 | IQAir |
| Bakersfield | Live AQI | 96 | 2026-10-27 | IQAir |
| Yucca Valley | PM2.5 (μg/m³) | 3.4 | 2019 | IQAir |
| Portola | PM2.5 (μg/m³) | 16.9 | 2019 | IQAir |
| Maywood | PM2.5 (μg/m³) | 16.5 | 2019 | IQAir |
| Walnut Park | PM2.5 (μg/m³) | 16.3 | 2019 | IQAir |
What does AQI actually measure?
The Air Quality Index (AQI) is a single number on a fixed scale that summarizes air pollution at one place and time. It does not measure one substance. It converts the concentration of several pollutants into separate values, then reports the highest one. Two cities can show the same AQI while being driven by different pollutants.
The six criteria pollutants
The AQI covers six criteria pollutants:
| Pollutant | What it is | Typical sources |
|---|---|---|
| PM2.5 | Fine particles, small enough to penetrate deep into the lungs | Combustion, smoke, traffic exhaust |
| PM10 | Coarse particles, larger than PM2.5 | Dust, construction, road wear |
| Ozone | Gas formed when sunlight reacts with precursor emissions | Forms in the air rather than being emitted directly |
| NO2 | Nitrogen dioxide, a gas | Road traffic, industrial and power combustion |
| SO2 | Sulfur dioxide, a gas | Burning of sulfur-containing fuels, industry |
| CO | Carbon monoxide, a colorless gas | Incomplete combustion, vehicles |
Sub-indices and the worst-pollutant rule
Each pollutant’s measured concentration is converted into its own sub-index on the common scale, using breakpoint tables defined for that pollutant. The headline AQI for a location is the highest of the six sub-indices. The values are not averaged, so one elevated pollutant sets the headline figure.
Because the headline is a maximum, it does not show which pollutant caused it. Check the pollutant breakdown before concluding that one city is generally dirtier.
PM2.5: annual average versus daily AQI
These two measures answer different questions:
- Annual average: a long-term mean concentration in µg/m³. IQAir’s California page reports an average of 12.1 µg/m³ in 2018 across 112 cities, with 35.7% of cities meeting the WHO annual target, compared with 81.7% nationally.
- Daily AQI: a value for a specific day or moment, converted to the scale. It captures short episodes that a yearly mean smooths out. IQAir’s live ranking on 2026-10-27 listed Delano at 124.
A city with a high daily AQI can have a moderate annual PM2.5 average, and the reverse is also possible.
Which California cities have the worst air?
IQAir’s live ranking, captured on 27 October 2026, places Delano, Timber Cove and Shafter at the top of California’s most polluted cities by AQI. Bakersfield is also high, though lower in the list. These are live AQI readings, which describe one moment rather than a typical year.
| City | Live AQI (IQAir, 2026-10-27) |
|---|---|
| Delano | 124 |
| Timber Cove | 121 |
| Shafter | 118 |
| Bakersfield | 96 |
IQAir’s 2019 PM2.5 figures, in μg/m³ (micrograms per cubic metre), list the following as among the most polluted:
| City | PM2.5 2019 (μg/m³) |
|---|---|
| Portola | 16.9 |
| Maywood | 16.5 |
| Walnut Park | 16.3 |
For annual PM2.5 across US metros, IQAir cites the American Lung Association in naming Bakersfield, Fresno-Madera-Hanford and Visalia among the worst. The source gives no per-city ranks for these three, so they should be read as a group, not an ordered list.
Several caveats apply:
- The 2019 PM2.5 values and the live AQI figures come from different years and different methods.
- IQAir’s California data draw on about 5,825 stations, contributed by agencies including CARB, South Coast AQMD, Bay Area AQMD, San Diego County APCD and San Joaquin Valley APCD.
Which California cities have the cleanest air?
The cleanest California city in IQAir’s 2019 PM2.5 data is Yucca Valley, at 3.4 μg/m³. PM2.5 refers to fine particles smaller than 2.5 micrometres, and the figure is an annual average, so it describes a full year rather than a single day. The same dataset lists Portola, Maywood and Walnut Park among the most polluted cities, which shows how wide the spread is across the state.
Yucca Valley’s value is well below the state picture for 2018:
| Measure | Value | Year | Source |
|---|---|---|---|
| Yucca Valley, PM2.5 (cleanest listed city) | 3.4 μg/m³ | 2019 | IQAir |
| California average, annual PM2.5 (112 cities) | 12.1 μg/m³ | 2018 | IQAir |
| WHO annual PM2.5 guideline (older value) | 10 μg/m³ | n/a | IQAir |
| Share of California cities meeting the WHO target | 35.7% | 2018 | IQAir |
The 2018 figures show that only about one in three California cities met the 10 μg/m³ target. Yucca Valley’s 2019 reading falls under that threshold, but the 2018 data does not cover it.
What the reading does show:
- A low annual PM2.5 average for one city in one year.
- That the city was under the older WHO guideline in that dataset.
What it does not show:
- Air quality in other years. One year can differ from the next.
- Ozone or other pollutants, which PM2.5 figures do not capture.
- Whether conditions reflect the whole city or a single monitoring point.
For population size and density, the IQAir page cited here gives no figures for Yucca Valley or other low-pollution towns. Check official census or city population data before comparing towns on people per square mile or kilometre, since a low-pollution town can be sparsely settled or fairly dense.
How do wildfires and seasons change the ranking?
A California city’s position in an AQI ranking depends on when the reading is taken. The IQAir figures mix three time scales: a live AQI snapshot, a single-year average, and a multi-year comparison. Each one can rank the same cities differently, so a ranking is only meaningful for the period it covers.
| Time scale | What it captures | Ranking risk |
|---|---|---|
| Single-moment reading (live AQI, opened 2026-10-27) | Conditions at one instant | One smoke event or calm hour can move a city up or down |
| Annual PM2.5 average (2018, 2019) | Year-long exposure | More stable basis for ranking, but hides seasonal peaks |
| Station-level 2019 values | Each monitor’s reported average | Depends on which stations report that year |
Wildfire smoke and hourly swings
Smoke from wildfires can raise particulate readings for hours or days, so hourly AQI can sit far above a city’s typical level. The sources used here do not quantify these spikes, so no size of effect should be assumed. To test a city’s ranking under smoke conditions, pull hourly readings for the same station across the event window and compare them with that station’s annual average. A city that ranks high only during one event is ranked differently from one that is consistently high.
Summer ozone and winter inversions inland
Seasonal drivers differ between coastal and inland stations. The fiche contains no seasonal values, so the effects below are checks to run, not measured results:
- Seasonal split: Rank each city separately for each season, then see whether the seasonal orders match the annual order.
- Summer ozone and winter inversion periods are the two seasonal patterns to look for at inland sites, since they can produce different leaders in different seasons.
Year-to-year shifts between 2018 and 2019
The 2018 IQAir data give a state-level figure: California averaged 12.1 μg/m³ across 112 cities, and 35.7% of cities met the WHO annual target, compared with 81.7% nationally. The 2019 data list individual cities, with Yucca Valley at 3.4 μg/m³ as the cleanest and Portola (16.9), Maywood (16.5) and Walnut Park (16.3) among the most polluted.
The fiche does not give city-by-city 2018 values, so a 2018-to-2019 shift in individual city positions cannot be measured from it. A valid year-to-year comparison needs the same station set and the same metric in both years, then a rank for each city in each year.
Where to find official city AQI data
California’s city-level air quality data comes mainly from state and regional monitoring networks. Aggregators such as IQAir compile that data into one view. Use the primary agency records as your reference, and use aggregators to find cities worth a closer look or to cross-check a figure.
The contributors named in IQAir’s California data are:
- CARB (California Air Resources Board)
- South Coast AQMD
- Bay Area AQMD
- San Diego County APCD
- San Joaquin Valley APCD
IQAir reports that its California data draws on about 5,825 stations. Its live ranking, opened on 2026-10-27, listed Delano (AQI 124), Timber Cove (121) and Shafter (118) as the most polluted California cities, with Bakersfield at 96. Treat these as a starting point for research rather than a measure of typical air quality.
To work from the agency data directly:
- Identify the agency behind each reading. Aggregator pages name their contributing agencies, so go to that agency’s own site for the underlying records.
- Check the time resolution offered. Agency data pages may provide hourly or annual records. Choose the resolution that matches your question: a single day’s conditions or a multi-year trend.
- Record the station. A city can have several monitors with different readings, so note which one each figure comes from.
How to compare air quality before choosing where to live?
Compare candidate cities on a multi-year annual PM2.5 average, not on a single reading. Use the same three steps for every city on your shortlist: check the multi-year trend, check seasonal peaks, then weigh the results against daily costs.
Step 1: Use multi-year annual PM2.5 averages
For each candidate, collect several consecutive years of annual averages and note whether the trend is stable, improving, or worsening. The IQAir data give these reference points:
| Reference point (IQAir) | Value | Context |
|---|---|---|
| California average PM2.5, 112 cities, 2018 | 12.1 μg/m³ | Annual average across the cities covered |
| Share of California cities meeting the WHO annual target, 2018 | 35.7% | Compared with 81.7% nationally |
| WHO annual PM2.5 guideline cited on the page | 10 μg/m³ | Older guideline; the page may not reflect the current one |
Step 2: Compare seasonal and wildfire-season values per candidate
An annual average can hide short periods of high readings. For each city, split the data into seasons and identify the months with the highest values. Check whether the wildfire season is captured in that breakdown, and compare its peak against the city’s annual average.
Confirm which monitoring station serves each candidate. IQAir’s California data come from about 5,825 stations, with contributors including CARB, South Coast AQMD, Bay Area AQMD, San Diego County APCD, and San Joaquin Valley APCD. Station coverage differs by city, so a reading from a distant station may not represent a neighborhood.
Step 3: Weigh air data against commute, housing, and services
Air quality is one criterion among several. Build a scoring sheet with one row per candidate and columns for:
- Air trend: multi-year annual PM2.5 average and direction of change.
- Seasonal peak: highest seasonal value, including wildfire-season months.
- Commute: time and mode to your main workplace.
- Housing: median home price per square foot from county recorder or public sales records.
- Services: distance to healthcare, schools, and shops.
A city with cleaner annual air but a longer commute can cost more in time and money than a city with slightly higher PM2.5. Record that trade-off explicitly before deciding.