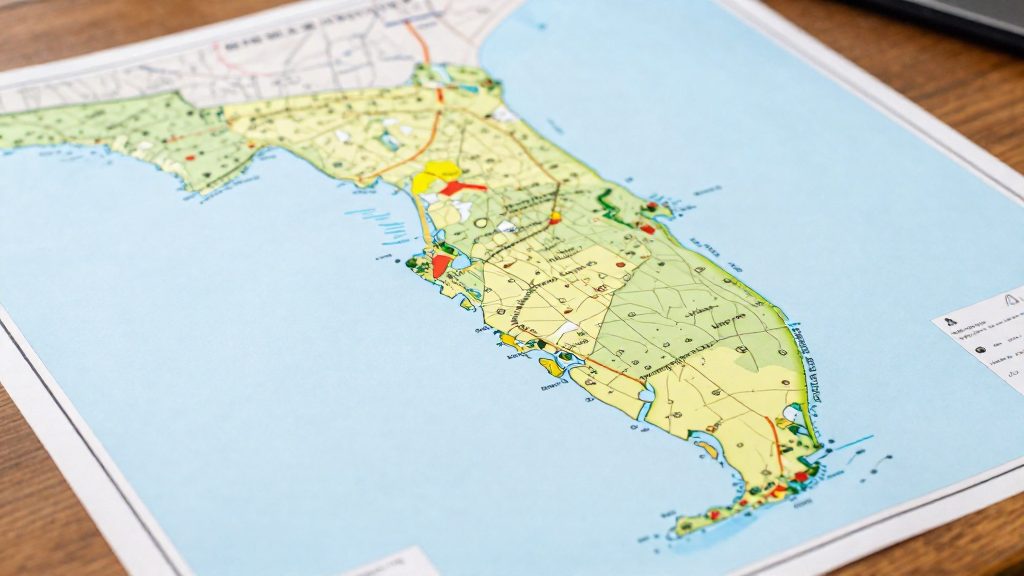
Florida’s FEMA flood zones are not drawn from one statewide standard applied identically to every county. Each county’s boundaries come from its own mapping study, which combines local elevation data, terrain, and drainage and levee conditions. Two neighboring counties can therefore show different flood zone footprints for similar coastal or riverine exposure. The LawnStarter ranking reflects this variation in risk: Volusia (No. 7), Miami-Dade (No. 8), St. Johns (No. 9), Brevard (No. 10) and Dixie (No. 12) all placed in the national top 12 for flood risk. That ranking uses broader measures than the mapped boundary alone, including expected annual loss, mobile home residents and insurance demand, all drawn from FEMA and U.S. Census Bureau data.
Why FEMA flood zones differ from county to county
How map update cycles create uneven boundaries
Flood insurance rate maps are revised over time, not all at once. A county whose map was revised more recently reflects newer terrain and development conditions than a neighbor whose map was last updated earlier. Compare the effective date printed on each county’s map before comparing boundaries, because two maps of the same region may rest on different vintages of information.
Local elevation data and terrain
Zone boundaries depend on the elevation data used in each study. Where a county has more detailed or more recent ground elevation, the modeled floodwater level meets the land at different points, which shifts zone lines parcel by parcel. On flat terrain, small elevation differences decide whether a property falls inside or outside a mapped zone. Higher ground can keep parcels outside a zone even when neighboring land is inside it.
Drainage infrastructure and levee certification
Drainage canals, pumps and retention systems change how floodwater moves, so mapping studies account for them when modeling flood extent. Levees are handled according to their status. A levee certification that FEMA recognizes can reduce the mapped hazard behind it, while a levee without that recognition may leave the protected area inside a zone. Confirm a levee’s status with the local floodplain administrator rather than assuming protection from its presence.
What do FEMA flood zone letters mean?
FEMA labels each mapped area with a zone letter that classifies its flood hazard. Before you compare counties, read the letter for the specific parcel, because it places the property in one of three groups: high-risk, moderate or low-risk, or undetermined.
| Group | Zone letters | What the designation means |
|---|---|---|
| High-risk, A-series | A, AE, AH, AO, AR, A99 | Flood hazard areas classified as high-risk |
| High-risk, V-series | V, VE | High-risk zones that add storm-wave hazards |
| Moderate and low-risk | B, C, X | Moderate or low-risk zones |
| Undetermined | D | Risk is not determined |
The six A-series letters share the high-risk classification. This section does not rank them or describe how they differ from one another.
The V-series is the coastal branch of the high-risk group. V zones add storm-wave hazards to the flood classification, which means a parcel can carry high-risk status for reasons beyond river or surface flooding.
B, C and X form the moderate and low-risk group. They are the lower classifications in FEMA’s scheme, but they are still zones that FEMA maps for flood risk.
A county is not a single zone. Most counties contain parcels in several groups, so a county-level comparison should be built from the letters on the parcels you are considering, not from one label applied to the whole county.
Which Florida counties rank highest for flood risk?
In a LawnStarter ranking of more than 940 U.S. counties, Volusia County placed No. 7, the highest of the Florida counties reported. Miami-Dade (No. 8), St. Johns (No. 9), Brevard (No. 10) and Dixie (No. 12) also made the national top 12, so five Florida counties appear there. Duval (No. 24) and Lee (No. 27) ranked outside the top 20. The ranking was reported by Patch on 2024-06-13.
Florida placements in the national ranking
| Rank | County | Placement |
|---|---|---|
| 7 | Volusia | Top 12 |
| 8 | Miami-Dade | Top 12 |
| 9 | St. Johns | Top 12 |
| 10 | Brevard | Top 12 |
| 12 | Dixie | Top 12 |
| 24 | Duval | Just outside top 20 |
| 27 | Lee | Just outside top 20 |
What the ranking measures
The reported methodology combines three types of inputs, drawn from FEMA and U.S. Census Bureau data:
- Flood risk and expected annual loss from riverine and coastal flooding in each county
- The number of residents living in mobile homes
- Local demand for flood insurance
The published summary does not give the weight of each input. A high placement can therefore reflect any one of these factors, or a combination, and the source does not separate them.
Limits of a county-level ranking
A county-level ranking shows where exposure is concentrated, not where every property is at risk. Counties outside the top 12 can still have significant flood claims. Use the ranking to build a shortlist.
How do evacuation zones differ from flood zones?
An evacuation zone tells residents whether they must leave before a hurricane arrives. A FEMA flood zone describes long-term flood risk for insurance and building purposes. The two are issued by different authorities, measure different things, and do not map onto each other. A home can sit in a low-risk FEMA zone and still fall inside an evacuation zone, or the reverse.
Evacuation zones are typically set at the county level by emergency management. Each county labels its zones with letters or other identifiers that vary by county, so the label in one county has no fixed meaning in another. Zone boundaries are drawn from modeled storm surge, the rise in seawater pushed inland by a hurricane’s winds. Surge modeling, run with the SLOSH model, estimates how far water would travel for storms of different strengths and along different tracks. Evacuation orders are tied to the forecast: officials issue them ahead of expected landfall, and the lead time depends on the storm’s track and intensity. Orders can cover a single zone or several at once.
FEMA flood zones work differently. They are fixed map designations, such as the high-risk zones A, AE, AH, AO, AR, A99, V and VE, that set insurance requirements. They do not change when a storm approaches, and they do not tell you when to leave.
| Feature | Evacuation zone | FEMA flood zone |
|---|---|---|
| Issued by | County emergency management | FEMA, under the National Flood Insurance Program |
| Based on | Modeled storm surge for hurricane scenarios | Flood hazard mapping |
| Changes during a storm | Yes, through evacuation orders | No |
| Drives | Whether to leave and when | Insurance requirements and building rules |
How can you compare flood risk between two counties?
To compare two Florida counties on flood exposure, run the same three checks on each county and place the results side by side. Use identical data sources and the same geographic boundaries for both, or the comparison will not hold. This method relies on public data (federal FEMA and Census Bureau data plus county parcel records), so you can reproduce it without relying on a ranking score.
Step 1: Compare FEMA flood hazard layers
Open FEMA’s Flood Map Service Center and load the flood hazard layer for each county. Record which zones appear and how much of each county falls in each one. Zones A, AE, AH, AO, AR, A99, V and VE are high-risk. Zone D means risk is undetermined, so a county with large areas of D is harder to assess, not safer.
| Zone group | FEMA zones | What it means |
|---|---|---|
| High-risk | A, AE, AH, AO, AR, A99, V, VE | Flood insurance is mandatory for federally backed mortgages in NFIP-participating communities; V zones add storm-wave hazards |
| Moderate/low | B, C, X | Lower classifications that FEMA still maps for flood risk |
| Undetermined | D | Risk has not been determined |
Step 2: Calculate the share of parcels in special flood hazard areas
Parcel counts show how many properties are exposed, which is more useful than total land area. Join county parcel data to the FEMA hazard layer in GIS software, then calculate:
Parcel share (%) = parcels inside high-risk zones ÷ total parcels in county × 100
Compare the percentages across the two counties. A large county can have a low share even if its coastal strip is heavily mapped, so read the percentage alongside the raw parcel count.
Step 3: Measure housing stock and mobile home counts
The LawnStarter methodology, reported by Patch, used U.S. Census Bureau data on the number of residents living in mobile homes as one exposure factor. Pull total housing units and mobile home units for each county from Census data, then calculate:
Mobile home share (%) = mobile home units ÷ total housing units × 100
Use units for the share, and residents if you want to replicate the ranking’s exact input.
Does a low-risk zone mean no flood risk?
No. A low-risk designation lowers the probability of flooding but does not remove it. According to FloodSmart.gov, about 1 in 3 flood insurance claims come from low- and moderate-risk zones (B, C and X), so a meaningful share of claims arise outside the high-risk group.
Flood maps are built around specific sources of flooding, mainly riverine and coastal water. Flooding from heavy rainfall can also occur outside mapped high-risk zones, and a zone letter does not describe how a particular street or parcel drains. For this reason, a county-level comparison can hide significant differences between neighborhoods.
The LawnStarter ranking shows how county-level results vary. Volusia (No. 7), Miami-Dade (No. 8), St. Johns (No. 9) and Brevard (No. 10) rank in its top 10, while Duval (No. 24) and Lee (No. 27) rank outside the top 20. These are relative positions among more than 940 counties, not measures of how often a given property floods.
Residual flood exposure therefore persists in low-risk properties. It depends on local drainage and elevation, among other factors.
What flood risk means for home prices and insurance
The flood zone designation of a specific property is the main factor in whether flood insurance is required to finance it: coverage is mandatory for federally backed mortgages in high-risk zones in NFIP-participating communities, and lenders may set their own requirements, so confirm with your lender. According to FloodSmart.gov, flood insurance is mandatory for federally backed mortgages in high-risk zones in NFIP-participating communities. For a buyer, the designation therefore affects loan conditions, the total monthly cost of ownership, and, indirectly, how homes are priced across a county. Comparing counties means looking at three linked items: the coverage requirement, the premium, and the resulting price gap.
Mandatory coverage attaches to the mortgage, not to the county line. Lender requirements can vary by property, so confirm with your lender whether coverage is required for a specific parcel before assuming an exemption.
Premium differences between zones are the main cost variable to compare. This section gives no premium figures, because they depend on the property. The method is:
- Request flood insurance quotes for a home of identical value in each county being compared.
- Record the annual premium separately for each zone designation.
- Add the premium to the mortgage payment to get the full monthly cost. Two counties with similar list prices can differ materially in total cost of ownership.
This article has no home price data by flood zone, so a county-level price effect cannot be stated here. To measure the gap, compare median sale prices for comparable homes within each county, separated by zone designation where local sales records allow. Then check whether the difference holds after adjusting for home size and construction year. If a gap appears, it is consistent with buyers pricing in insurance costs and expected flood exposure, which is the mechanism to test in the data.
Frequently asked questions
Why do flood zone boundaries differ between two Florida counties?
Each county’s FEMA flood zone boundaries come from its own mapping study, which uses local elevation data, terrain, drainage, and levee conditions. Maps also carry different effective dates, so neighboring counties may rest on different vintages of information.
Does a flood zone letter mean I have to buy flood insurance?
Not always. Coverage is mandatory for federally backed mortgages in high-risk zones in NFIP-participating communities, but lenders can set their own requirements, so confirm with your lender before assuming you are exempt.
Is a property in a low-risk zone free of flood risk?
No. Zones B, C and X are lower-risk classifications, yet about 1 in 3 flood insurance claims come from low- and moderate-risk zones, and heavy rainfall can cause flooding outside mapped high-risk areas. A zone letter describes the mapped flood hazard, not how a specific street or parcel drains.