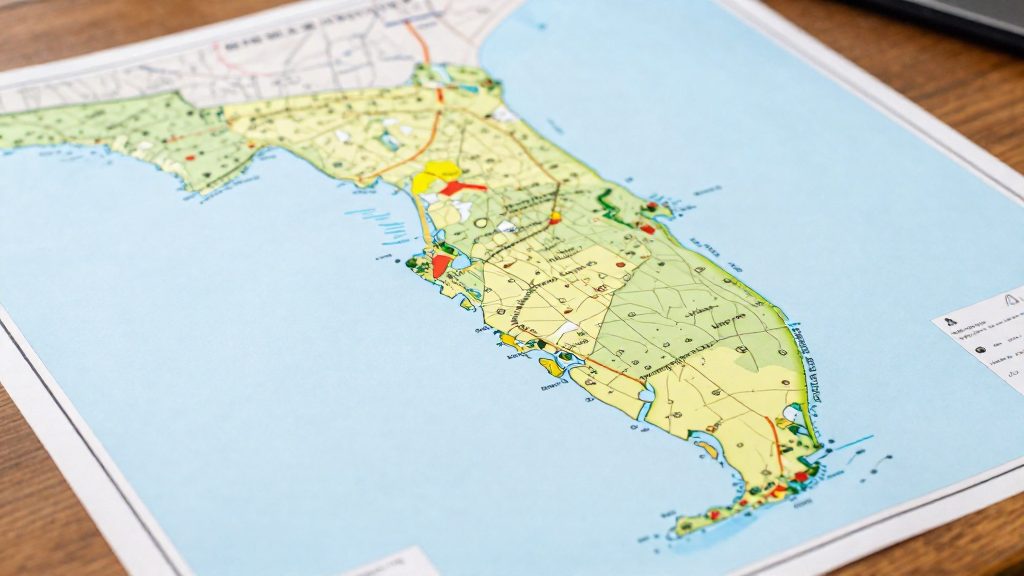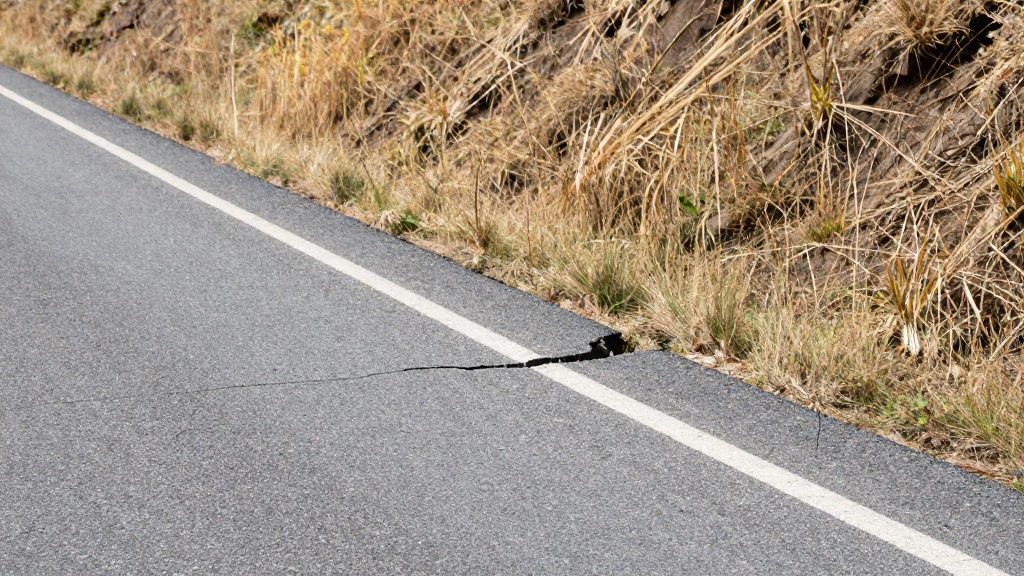
California and Oregon face different earthquake sources. California’s exposure is tied mainly to shallow crustal faults that rupture within the upper crust, often near populated land. Oregon’s coastal exposure is dominated by the offshore subduction megathrust of the Cascadia Subduction Zone. The two states therefore differ in where the energy originates, and that difference shapes which cities feel the strongest shaking.
How do California and Oregon earthquake risks differ?
Shallow crustal faults versus offshore subduction megathrust
- Crustal faults (California): The rupture source sits beneath or near inhabited land, so a damaging event can affect cities directly.
- Subduction megathrust (Oregon coast): The rupture source is offshore, so the main impact is shaking and tsunami exposure on the coast rather than directly under inland cities.
- Reach: The Cascadia zone’s length means its exposure extends into northern California as well as Oregon and Washington’s coast.
A coastal city’s hazard profile therefore depends on which of these two sources it sits closest to, not only on the state it belongs to.
Coastal shaking of 5 to 7 minutes
A Cascadia earthquake could bring 5 to 7 minutes of shaking on the coast, with a tsunami up to 100 feet high. Shaking of this length is the key coastal-specific figure for comparing coastal municipalities. The same source could also leave services and assistance unavailable for at least two weeks, so the practical question for a coastal buyer or renter is whether a home has its own water, heating, and supplies for that period.
Why statewide maps cannot rank individual cities
A statewide hazard map describes how hazardous a large region is. It does not describe how a specific neighborhood will shake. Two cities in the same state can sit on different ground, contain buildings of different ages and construction standards, and lie at different distances from the same fault. A statewide score cannot order them. Ranking cities requires address-level or site-specific information, such as local geology and the construction details of individual buildings.
What the USGS hazard model shows
The 2023 USGS National Seismic Hazard Model is the federal reference for estimating earthquake shaking across the United States. Reported coverage of the 2023 model says that nearly all of California has a more than 95% chance of a damaging earthquake in the next century (NBC Bay Area, January 16, 2024). This is a statewide headline. It describes a probability over a long window, not a forecast of when a quake will occur, and it does not show how strongly the ground will shake in any given city.
For a place-by-place comparison, the model’s output is a probabilistic hazard map. These maps are built by combining three kinds of input: the locations and activity of known faults, the rates at which earthquakes of different sizes have occurred, and models of how strongly shaking weakens with distance. The result is a set of estimates for each location, not a single predicted scenario.
To read these maps, focus on three ideas:
- Time window: Probabilities are stated over a period, such as the next century. A high probability over 100 years can correspond to a much smaller chance in any single year.
- Shaking level: The model estimates ground shaking, not building damage. Damage depends on shaking strength, soil conditions, and construction.
- Hazard curve: Each location has a hazard curve, which plots shaking level against the annual exceedance probability, meaning the chance per year that shaking will exceed that level.
| Element | What it measures | How to use it in a comparison |
|---|---|---|
| Probability over a time window | Chance of at least one damaging quake in a set period | Compare states or regions on the same window |
| Hazard curve | Shaking level versus annual exceedance probability | Compare two cities at the shaking level that matters for your use |
| Annual exceedance probability | Yearly chance that shaking exceeds a level | Convert to longer periods with: 1 minus (1 minus annual probability) raised to the number of years |
Cascadia vs San Andreas: two fault systems
The Cascadia Subduction Zone is an offshore megathrust system, not a fault that runs through land. It is about 700 miles long, runs from northern California to British Columbia, and lies roughly 70 to 100 miles off the Pacific coast. That offshore position is the main geometric difference from the San Andreas, which runs through California’s inland terrain.
Rupture history
The last great Cascadia earthquake struck on January 26, 1700, with an estimated magnitude of 9.0. Its tsunami reached Japan. No comparable rupture dates for the San Andreas are provided here, so the two histories cannot be compared by date with this data alone.
Recurrence and probability
Scientists estimate about a 37% chance of a magnitude 7.1 or greater megathrust earthquake on the Cascadia fault within 50 years. This is a probability over a time window, not a forecast of a specific date.
| Metric | Cascadia value |
|---|---|
| Length | About 700 miles |
| Distance offshore | Roughly 70 to 100 miles |
| Last great rupture | January 26, 1700 |
| Estimated magnitude of last rupture | 9.0 |
| Probability of M7.1+ within 50 years | About 37% |
How to compare the two faults
Use the same four metrics for each fault: length, distance from the coast, date of the last major rupture, and probability over a stated magnitude and time window. Do not set a 50-year probability for one fault against a different magnitude threshold or time window for the other.
How to compare fault exposure across California metros
The fact sheet gives no city-level fault distances, fault-zone maps, or hazard scores for Los Angeles, San Francisco, San Jose, or Oakland, so this section cannot provide a verified ranking.
How to rank metros by fault exposure
A ranking needs two measurements for each metro:
- Fault proximity: the distance from the city center to the nearest mapped fault trace.
- Mapped fault-zone status: whether a given parcel lies inside a mapped Alquist-Priolo Earthquake Fault Zone.
Run the same test on each metro:
- List the mapped fault traces within a fixed radius of the city centre.
- Overlay parcel boundaries and flag any parcel inside a mapped Alquist-Priolo zone.
- Record the counts and distances in one table, then rank the metros.
| Metro | Region | Test to run |
|---|---|---|
| Los Angeles | Southern California | Fault traces within the radius, and share of parcels inside a mapped zone |
| San Francisco | Bay Area | Same test, same radius |
| San Jose | Bay Area | Same test, same radius |
| Oakland | Bay Area | Same test, same radius |
The Bay Area comparison (San Francisco, San Jose, Oakland) and the Southern California comparison (Los Angeles) only mean something once every metro has been measured the same way. Do not assume one region ranks higher from the statewide figure alone.
Offshore sources
The Cascadia Subduction Zone lies offshore, so it is kept separate from the in-metro fault proximity test above.
Which Oregon cities are most exposed?
Exposure in Oregon depends on two sources. The first is the offshore Cascadia Subduction Zone. The second is crustal faults inside the state. Coastal towns are closest to the offshore source, Willamette Valley cities are farther inland, and Bend and Klamath Falls are tied mainly to local faulting. The sections below separate these cases so each town is assessed against the source that affects it.
Coastal towns: closest to the offshore source
Seaside, Cannon Beach, Newport and Coos Bay sit on the Pacific side of the state. Shaking duration and tsunami exposure are the main factors for these towns. Shaking applies across the coastal strip, while tsunami exposure varies by elevation and mapped inundation zone. Access to supplies and emergency response is a practical concern for coastal residents.
Willamette Valley: Eugene and Salem
Eugene and Salem lie inland in the Willamette Valley, farther from the offshore fault than the coastal towns. The fact sheet gives no shaking figures for either city, so this comparison stays qualitative. To compare them with the coast, check each town’s distance from the Pacific shoreline, then weigh the coastal figures against the age and construction type of the local building stock.
Inland Oregon: Bend and Klamath Falls
Bend and Klamath Falls are the farthest from the offshore zone, so their main exposure comes from local crustal faults rather than the Cascadia megathrust. The fiche does not name specific crustal faults or give their magnitudes, so no figures are provided here. When comparing these towns, the useful question is whether a mapped crustal fault lies near a given property, and whether emergency services remain reachable.
| Group | Towns | Main hazard source | Fiche-backed note |
|---|---|---|---|
| Coastal | Seaside, Cannon Beach, Newport, Coos Bay | Cascadia Subduction Zone (offshore) | Closest to the offshore source |
| Willamette Valley | Eugene, Salem | Cascadia, from farther inland | No shaking figures in the fiche |
| Inland | Bend, Klamath Falls | Local crustal faults | No fault names or magnitudes in the fiche |
Is Portland safer than Los Angeles?
The fact sheet does not rank Portland against Los Angeles, and its figures measure different hazards, so no simple “safer” verdict follows. Portland’s documented exposure comes from the Cascadia Subduction Zone. Los Angeles is in southern California, which the fact sheet does not place inside the Cascadia zone. Its figures come from the statewide USGS model instead.
Fault density cannot be compared from the fact sheet, which gives no fault count for either city. To check it, overlay the USGS fault maps for each metro area on a single map and count mapped faults within a fixed radius of each city centre.
Recovery time cannot be compared either. The two-week figure refers to a Cascadia event on the coast, not to Portland specifically, and no equivalent duration is available for a Los Angeles event.
Building stock age and retrofit requirements also have no figures in the sheet. To compare them, pull the year-built field from each county assessor’s records for the neighbourhoods you are evaluating, then check with each city’s building department which retrofit requirements apply to older structures.
Soil, liquefaction and tsunami zones
Within a single city, the ground under a building can change how strongly an earthquake is felt, in addition to the effect of distance from the fault. Three local factors matter most: soil amplification, liquefaction susceptibility, and tsunami inundation.
- Soil amplification: Loose or soft sediment can increase shaking compared with solid bedrock nearby. Soil classification therefore affects expected shaking at the same distance from the fault.
- Liquefaction: Saturated, loose sandy soils can lose strength during shaking and behave temporarily like a fluid. Susceptibility is usually mapped in classes, so the same street can carry a different level of risk from the block next to it.
- Basin sediment effects: Sediment-filled basins can trap seismic waves, which tends to prolong shaking.
Tsunami exposure is set by elevation and distance from the shoreline rather than by soil type. The reference data states that a Cascadia earthquake could generate a tsunami up to 100 feet high. Inundation zones are the relevant map layer for coastal parts of any city.
To compare two cities properly, check the following for each candidate address:
- The local soil or liquefaction susceptibility map published by the relevant state or city agency.
- Whether the address falls inside a mapped tsunami inundation zone.
- The approximate distance from the coast, and the ground elevation.
- Whether the parcel sits on fill or former wetland, which is often mapped separately.
What to check before choosing a city
The regional figures describe exposure across a whole state or coast. Earthquake risk for a purchase has to be checked at the level of the specific address and building.
| Check | What to verify | Where to find it |
|---|---|---|
| Earthquake insurance | Whether an earthquake policy or endorsement is offered at the address, and its deductible | Written quote from an insurer or agent |
| Building age and retrofit | Construction year and any seismic or structural work on record | County assessor and building department records; seller disclosures |
| Hospital and school ratings | Seismic performance rating of the facilities that would serve the address | Public facility inventories maintained by the state or school district |
Earthquake insurance. Request quotes for the exact address, not the city. Compare deductibles only when both quotes state them in the same unit, and convert them to dollars against the same dwelling coverage amount. A deductible that looks low on one quote can cost more than a higher-priced policy with a smaller one.
Building age and retrofit. Year built is the first filter. Confirm it in assessor or building department records, then review the permit history for seismic retrofit or structural work. If the seller cannot document permits, treat retrofit status as unknown and budget for an inspection by a licensed structural engineer before closing.
Hospital and school ratings. List the hospitals and schools that would serve the address, then check their seismic ratings in public facility inventories. A rating describes the building only. It does not show staffing levels or whether access roads would stay open after a quake.
Frequently asked questions
Does an earthquake in Oregon threaten inland cities like Portland the same way it threatens the coast?
The main coastal-specific figures, including 5 to 7 minutes of shaking and a tsunami up to 100 feet high, apply to the coast rather than to inland cities such as Portland. Inland cities face a different exposure profile, so a coastal hazard figure should not be transferred to them without checking the local situation.
Why does the Cascadia Subduction Zone matter for a California buyer?
The Cascadia zone runs about 700 miles from northern California to British Columbia, so its exposure reaches the northern part of California as well as Oregon and Washington’s coast. A home in northern California should therefore be assessed against both the crustal faults of the region and the offshore subduction megathrust, rather than against one source alone.
Can a statewide hazard map tell me which city is safer for earthquakes?
No. A statewide hazard map describes the hazard of a large region, not how a specific neighborhood will shake. Comparing two cities requires looking at the local conditions and the specific address.