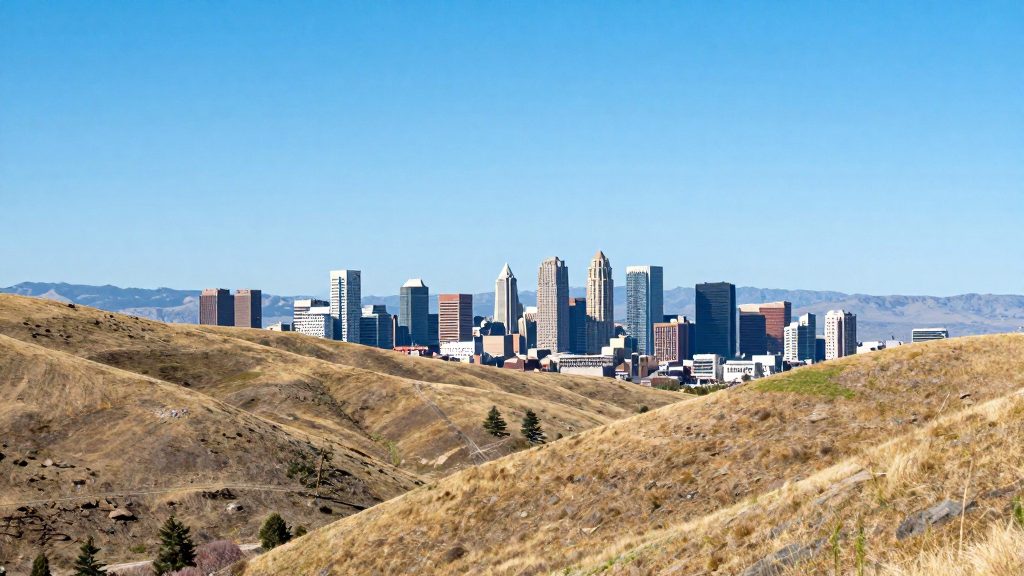
Which City Gets More Sunshine?
Salt Lake City leads on annual percent of possible sunshine, 66% against 64% for Boise.
| City | Annual percent of possible sunshine |
|---|---|
| Salt Lake City | 66% |
| Boise | 64% |
Source: Western Regional Climate Center, Desert Research Institute.
What the metric measures
Percent of possible sunshine is the share of the maximum possible sunshine duration that is actually recorded. A value of 66% means that, across the averaging period, sunshine was recorded for 66% of the time it could have been, given day length and the sun’s position. Because it is a ratio, it shows how consistently sunny a location is, not how many hours it logs in total.
How to use the verdict
- The difference is small. A two-point gap does not indicate that one city is markedly sunnier in daily experience.

Annual Sunshine Hours Compared
Current Results reports average annual sunshine of 2,993 hours in Boise and 3,029 hours in Salt Lake City, a gap of 36 hours in favor of Salt Lake City (Current Results). These totals are the most direct absolute measure of sunshine in the two cities, though the underlying NOAA tables and exact measurement periods were not independently verified.
| Metric | Boise | Salt Lake City |
|---|---|---|
| Average annual sunshine (hours) | 2,993 | 3,029 |
| Clear days per year (cloud cover at most 30%) | 120 | 125 |
Clear days are defined by Current Results as days when cloud covers at most 30% of the sky during daylight hours. Under this definition, Salt Lake City records 125 clear days per year against Boise’s 120 (Current Results).
Figures for hours and clear days come from the same publisher and should be read as a comparison of relative magnitude rather than a precise difference. A second source, Climechart, reports average sunshine of 9.62 hours per day for Boise and 9.88 hours per day for Salt Lake City over 2013–2023. These daily averages do not reconcile with the annual totals above, and their measurement methodology has not been verified, so they should not be combined with the annual figures.
Monthly Sunshine Patterns
The Western Regional Climate Center publishes monthly percentages of possible sunshine, including spring and autumn. These historical station figures allow monthly comparisons, but the supplied evidence does not establish current sunshine normals. The annual totals are close, at 2,993 hours in Boise and 3,029 hours in Salt Lake City according to Current Results, so the overall gap is narrow.
Daylight length sets the ceiling for possible sunshine in each month, and it reverses between summer and winter. Weather Spark gives these averages:
| Month | Boise | Salt Lake City |
|---|---|---|
| June, average daily daylight | 15.4 hours | 15.1 hours |
| December, average daily daylight | 9.0 hours | 9.3 hours |
Boise has more daylight hours in June, while Salt Lake City has more in December. This is daylight, not measured sunshine, but it shows that the cities’ relative position can shift with the season.
Winter inversions are a cold-season effect, so late autumn and winter months in Boise should be checked individually rather than judged from annual totals.
Current Results reports clear days at 120 per year in Boise and 125 in Salt Lake City, and does not break this down by month.
Which City Has Sunnier Winters?
In December and January, Salt Lake City records a higher share of possible sunshine than Boise, according to the Western Regional Climate Center at the Desert Research Institute. Salt Lake City reaches 42% in December and 45% in January, while Boise reaches 38% and 40%. The gap is 4 percentage points in December and 5 in January, and it runs in the same direction both months.
| Month | Boise | Salt Lake City | Difference |
|---|---|---|---|
| December | 38% | 42% | Salt Lake City +4 points |
| January | 40% | 45% | Salt Lake City +5 points |
Boise’s winter pattern is linked to its winter inversions. This is a plausible contributor to Boise’s lower December and January figures, but the percentages alone do not separate the inversion effect from other influences.
Summer Sunshine and Outdoor Living
In July and August, Boise records a higher share of possible sunshine than Salt Lake City. The Western Regional Climate Center (Desert Research Institute) lists percent of possible sunshine at 87% in July and 85% in August for Boise, compared with 83% and 82% for Salt Lake City. Percent of possible sunshine is the share of the daylight period in which sunshine actually reached the ground, so a higher value means fewer hours lost to cloud cover.
| Month | Boise | Salt Lake City | Difference (percentage points) |
|---|---|---|---|
| July | 87% | 83% | 4 |
| August | 85% | 82% | 3 |
The gap is small: in both cities, more than four-fifths of possible sunshine is recorded in each of these months. Boise has a higher recorded share of possible sunshine in these summer months, but these percentages alone do not establish how much the difference affects outdoor daily life. The percentages do not show how many hours fall within specific times of day, so they do not indicate when outdoor activity is most comfortable.
Practical planning for summer months
- Match outdoor tasks to the sunshine window. Schedule strenuous outdoor work or exercise for early morning or evening, when temperatures are typically lower, and reserve midday for indoor tasks.
- Plan shade alongside sun. Consider shade structures, awnings, or tree cover when assessing a property’s outdoor space; the sunshine percentages alone do not establish usable outdoor time.

Sunshine Hours Versus Daylight Hours
Daylight and sunshine measure different things. Daylight is the time between sunrise and sunset, regardless of cloud cover. Sunshine hours count only the time the sun is actually visible. A city can have long days and still record few sunshine hours if clouds persist.
Daylight length follows the calendar and latitude, so Boise and Salt Lake City have nearly identical values. According to Weather Spark, average daily daylight in June is 15.4 hours in Boise and 15.1 hours in Salt Lake City. In December, averages are 9.0 hours in Boise and 9.3 hours in Salt Lake City.
| Month | Boise (average daily daylight) | Salt Lake City (average daily daylight) |
|---|---|---|
| June | 15.4 hours | 15.1 hours |
| December | 9.0 hours | 9.3 hours |
The June figures show Boise with slightly more daylight, while the December figures show Salt Lake City with slightly more. These differences are small, under half an hour per day in either month.
Why long daylight does not guarantee sunshine: Daylight hours set the maximum window for sunshine, but clouds, fog and haze reduce how much of that window the sun is visible. A long June day in Boise does not translate into a long run of sunshine if the sky stays overcast.
Choosing Where to Live
The sunshine data points in different directions depending on the season, so the choice depends on which period matters more to you. Rank your priorities first, then compare the cities on those terms.
Weighing winter gloom against summer sunshine
| Priority | Data point | Edge |
|---|---|---|
| Winter light, December and January | Share of possible sunshine: 38% and 40% in Boise, 42% and 45% in Salt Lake City (Western Regional Climate Center, Desert Research Institute) | Salt Lake City |
| Summer sun, July and August | Share of possible sunshine: 87% and 85% in Boise, 83% and 82% in Salt Lake City (Western Regional Climate Center, Desert Research Institute) | Boise |
| Clear days | 120 per year in Boise, 125 in Salt Lake City (Current Results) | Salt Lake City, by a small margin |
If winter gloom is your main concern, the gap in the winter percentages is the more useful figure. If you spend most of your time outdoors in warm months, the Boise summer advantage matters more. The clear-day gap is small, so it should not decide the question alone.
Checking inversion exposure before buying or renting
The National Weather Service describes Boise’s winter inversions as lasting days or weeks, trapping low clouds and fog. These inversions can contribute to winter gloom, but the cited evidence does not establish their relative contribution or compare perceived gloom with sunshine percentages. The supplied sources do not establish neighborhood-level sunshine differences in either city, so investigate conditions at the specific address:
- Compare the property’s elevation with the surrounding valley floor. Lower, enclosed areas are more likely to hold fog.
- Visit on several cold winter mornings, not just a single afternoon.
- Ask current owners or neighbours how often fog lingers into the day.
- For Salt Lake City, check local forecasts and winter conditions in the same way before deciding.
Verifying sunshine data with NWS or WRCC
Use two official sources and confirm which metric each one reports:
- Western Regional Climate Center (WRCC), Desert Research Institute: station-based summaries that report possible sunshine as a percentage, which is not the same measure as annual hours.
- National Weather Service (NWS): local forecast office guidance on inversions and winter cloud and fog patterns.
- Check the weather station’s location against your target neighbourhood. A station at an airport or on the valley floor may not match a hillside address.
- Confirm the averaging period on the WRCC station records before quoting figures as current normals, and before comparing figures across sources.
The annual hour totals cited by Current Results come from NOAA publications, so check the primary tables before quoting them. The Climechart daily averages (9.62 hours for Boise and 9.88 for Salt Lake City, 2013–2023) differ substantially from the annual totals, and their method is not verified, so do not mix the two.