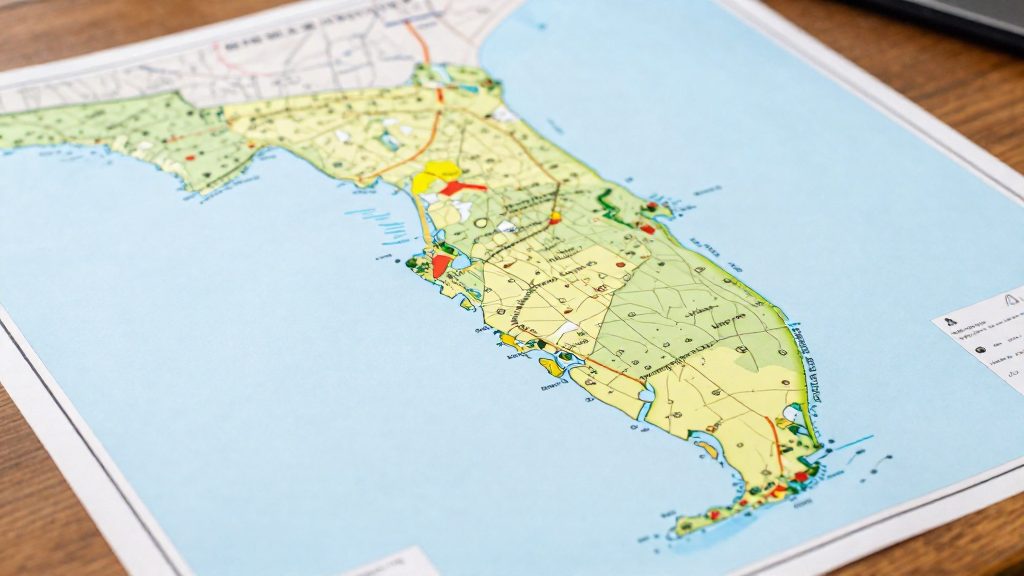
Florida households paid an average of $310 a month in utility bills in the doxo data reported by WFLA in 2022, versus $328 for the U.S. as a whole. That puts Florida $18 below the national U.S. benchmark. Tampa, at $323 a month, is the only Florida city with a figure in this dataset, and it sits closer to the national average than to the state average.
How much do utilities cost in Florida cities?
The doxo monthly averages below are the reference points for comparing utility bill levels in the state.
| Area | Average monthly utility bill (doxo, 2022) | Position vs. U.S. average |
|---|---|---|
| United States | $328 | Benchmark |
| Florida (state) | $310 | $18 below |
| Tampa | $323 | $5 below |
Reading the monthly figures
- Monthly utility average: each figure is the mean of the bills in the doxo sample, not the cost for a specific home. Actual bills depend on household size, dwelling type and usage.
- The state figure blends all Florida households, so it can hide differences between metro areas. Tampa’s figure is $13 above the statewide mean, so a large city can sit above the state figure, though it stays $5 below the national average.
- To convert a monthly average into an annual estimate, multiply by 12. For Tampa, that is $323 × 12 for a yearly approximation, which you can compare against any annual figure that uses the same data basis.
Limits of this comparison
The doxo figures are a 2022 snapshot. Utility rates change over time, so a 2022 monthly average should not be set against bills from a different year without adjustment. The dataset also covers only three reference points here (U.S., Florida, Tampa), so it cannot rank other Florida cities on its own.
Which Florida cities have the highest utility bills?
MoneyLion’s ranking of average annual utility costs across 20 Florida cities puts Tallahassee at the top, at $4,958 a year. The seven cities below are the ones with figures in the source data. The remaining 13 cities in the ranking are not listed here.
| Rank (of the 7 listed) | City | Average annual utility cost |
|---|---|---|
| 1 | Tallahassee | $4,958 |
| 2 | Gainesville | $4,875 |
| 3 | Largo | $4,866 |
| 4 | Jacksonville | $4,755 |
| 5 | Orlando | $4,731 |
| 6 | Cape Coral | $4,560 |
| 7 | Lakeland | $4,533 |
The three highest cities sit within $92 of each other, with Tallahassee leading Largo by $92. Jacksonville is about $111 below Largo, so the gap widens after the top three. Lakeland, the lowest listed city, is $425 a year below Tallahassee, the spread between the highest and lowest cities in the ranking.
Because the figures are annual averages, a $425 difference equals roughly $35 a month per household. The ranking reflects the average across each city and does not describe individual homes, which vary by size and usage.
Why is insurance so different from city to city?
Insurance prices can differ between cities because they depend on local competition, claims activity and loss rates rather than on shared service costs. The fact sheet does not provide city-level data on these drivers, so the points below explain the mechanisms and how to check them for a specific city, without asserting measured differences.
Insurer competition and carrier exits
An insurer prices a policy to cover expected claims plus its operating costs. In a market with many carriers actively writing policies, competitors have room to undercut each other. When carriers reduce their presence, pause new applications or leave a market, drivers and homeowners have fewer options, and that reduced choice can push prices up. Exits are often uneven within a state, so one city can keep several carriers while a nearby area is left with fewer.
To assess this for a given city:
- Count the carriers that write auto policies in the ZIP codes you compare, not only at the state level.
- Check whether any carrier has stopped accepting new business in that area.
- Get at least three quotes for identical coverage limits and deductibles, since carrier availability changes the spread.
Litigation and claims frequency
Auto premiums reflect how often claims are filed and what each claim costs to settle, including legal fees when disputes reach court. A market where claims are frequent or often litigated carries a higher expected cost, and insurers spread that cost across all policies written there. Two cities with similar traffic volumes can therefore show different premium levels if their claim-settlement patterns differ.
Vehicle theft and traffic accident rates by city
Theft and collision frequency are local conditions. Cities with more vehicle thefts or more crashes per registered vehicle generate more comprehensive and collision claims, which raises the cost base for every driver in that area. Raw incident totals are misleading for this purpose, because a larger city records more incidents simply because it has more residents and vehicles. The useful comparison is incidents per registered vehicle or per 1,000 residents, measured over the same period for each city.
Auto, health and homeowners insurance compared
Monthly auto and health premiums in Florida and Tampa differ sharply from each other, and their direction is not the same. Auto insurance costs more than the national average in both Florida and Tampa. Health insurance costs less than the national average in Florida and Tampa, though Tampa is above the Florida figure. Figures come from a doxo analysis reported by WFLA in 2022. Homeowners premiums are not covered by the source data.
Monthly auto and health premiums (doxo, 2022)
| Category | U.S. average | Florida average | Tampa average |
|---|---|---|---|
| Auto insurance | $196 | $262 | $339 |
| Health insurance | $123 | $43 | $75 |
Annual equivalents, calculated by multiplying the monthly figures by 12:
| Category | U.S. | Florida | Tampa |
|---|---|---|---|
| Auto insurance | $2,352 | $3,144 | $4,068 |
| Health insurance | $1,476 | $516 | $900 |
Auto insurance
- Florida averages $66 a month more than the U.S. average, about 34% higher.
- Tampa averages $143 a month more than the U.S. average, about 73% higher.
- Tampa is $77 a month above the Florida average, about 29% higher.
Auto is the category where Florida and Tampa sit furthest above the national figure, and Tampa is furthest above both benchmarks there. The largest state-to-national gap in either direction is health insurance, which is $80 a month below the U.S. average in Florida.
Health insurance
- Florida averages $80 a month less than the U.S. average, about 65% lower.
- Tampa averages $48 a month less than the U.S. average, about 39% lower.
- Tampa is $32 a month above the Florida average, about 74% higher.
The Florida health figure is the lowest of the three benchmarks. Tampa’s figure is well below the national average but about 74% above the Florida average.
Homeowners insurance
The doxo data cited by WFLA does not report homeowners premiums for Florida or Tampa, so no city comparison can be made from it. Any homeowners figure you see for a specific city should be checked against its source, its year, and whether it reflects the same coverage level.
Are coastal Florida cities always more expensive?
Not necessarily, based on the figures available here. Among the listed cities, coastal location does not clearly predict higher utility costs. In the MoneyLion ranking of 20 cities, the highest average annual utility cost is inland Tallahassee at $4,958, ahead of Gainesville at $4,875 and Largo at $4,866. Insurance follows different rules. Premiums depend on a property’s exposure to wind and flood, not on distance from the shore alone.
Wind and hurricane deductibles in coastal counties
Many homeowners policies in coastal counties carry a separate wind or hurricane deductible alongside the standard all-peril deductible. These are often set as a percentage of the insured dwelling value rather than a flat dollar amount, so the out-of-pocket amount rises with the home’s insured value. When comparing policies, check three things on the declarations page:
- Whether the wind deductible is a percentage or a flat figure
- Whether it applies only to the dwelling or to other structures too
- Whether a separate hurricane deductible applies
Two policies with similar premiums can leave the owner with very different costs after a storm.
FEMA flood zones and NFIP premiums
A flood zone is a FEMA designation on Flood Insurance Rate Maps that indicates the property’s flood risk level. Federally backed mortgages on property in high-risk zones generally require flood insurance, and the National Flood Insurance Program (NFIP) is a common source of that coverage. NFIP premiums depend on the zone and on property characteristics, so two properties a short distance apart can carry very different premiums. The data available here does not include NFIP premium amounts, so compare actual quotes for specific addresses.
Check the zone for each exact address with FEMA’s Flood Map Service Center before comparing cities.
Inland Tallahassee outranks coastal cities on utilities
Tallahassee’s $4,958 is the highest in the 20-city set, above Largo ($4,866) and Jacksonville ($4,755). Lakeland, at $4,533, sits at the bottom.
How do total household bills compare in major metros?
Tampa households pay $2,081 a month for the 10 most common bills, which is 3.9% above the national average of $2,003. That figure comes from a 2022 doxo analysis reported by WFLA. The same analysis ranked the 50 largest U.S. cities by household bill costs, and five Florida metros appear in the list:
| Florida metro | Rank among 50 largest U.S. cities |
|---|---|
| Miami | 9th |
| Fort Lauderdale | 12th |
| Tampa | 18th |
| Orlando | 26th |
| Jacksonville | 30th |
Miami and Fort Lauderdale fall in the top 12 of the list, while Orlando and Jacksonville sit in the lower half of the ranking. Tampa is the only metro in this group with a published monthly total and a percentage gap from the national average, so it is the only Florida city in this section that can be placed against a dollar benchmark.
When comparing metros on this basis, keep three points in mind:
- Use the same bill basket. The totals cover the 10 most common bills, so a comparison is only valid against figures built on that same list.
- Read the rank as a position, not a dollar gap. A 9th-place rank and an 18th-place rank show order within the 50-city set, not how far apart the totals are.
- Benchmark against the national average. Expressing a metro total as a percentage of $2,003 gives a consistent reference point across cities.
Where to find official insurance and utility data
The utility and insurance figures in this comparison come from two kinds of source: federal survey data reported through MoneyLion, and a private billing dataset reported through the press. A state regulator’s rate filings are a further place to verify insurance claims, but no figure here comes from them. They differ in age, method and scope, so trace each figure to its origin before comparing cities.
| Source | Year | Figures in this comparison | Reported via |
|---|---|---|---|
| American Community Survey (ACS) and BLS surveys | 2024 (ACS) | Annual utility costs for 20 Florida cities | MoneyLion, dated 2026-03-19 |
| doxo billing data | 2022 | Monthly auto insurance, health insurance and utility bills for the U.S., Florida and Tampa | WFLA, citing doxo |
Federal survey data: ACS 2024 and BLS surveys
The ACS 2024 and BLS surveys are the public datasets behind the MoneyLion utility cost ranking, which also cites Sperling’s BestPlaces. MoneyLion does not describe its weighting or adjustment method in the fiche, so check the methodology note on each publisher’s site before reproducing a figure.
doxo 2022 data and its date limits
The WFLA report, citing doxo, gives average monthly figures for 2022. These are the only insurance and bill averages in the fiche that cover both Florida and individual cities. Because the data is from 2022, it is at least four years old when this article is published. Insurance premiums and utility rates change over that period, so treat doxo figures as a historical benchmark rather than a current price. The fiche does not describe the doxo sample, so do not present these averages as representative of every household.
Florida Office of Insurance Regulation rate filings
The Florida Office of Insurance Regulation maintains a rate filing database. The fiche contains no figures from it, so this comparison does not rely on it for any number. To verify an insurance claim, search the database by insurer and coverage line, note each filing’s date, and check whether the filing applies statewide or to a specific territory before attributing it to one city.