Philadelphia Restaurant Density: What the Count Measures and Why There Is No Neighborhood Ranking
Philadelphia’s restaurant density figures come from a Philadelphia Health Department food access report. It counted restaurants using two inputs, restaurant inspection records and online business searches, and limited the count to places primarily for on-premise consumption within city limits. Results are tallied by block group, with a citywide average of 5 restaurants per block group.
How restaurant density is measured
Three choices determine the final count: the data inputs, the scope, and the geographic unit. Each one shapes the figure, so comparisons with other cities or other sources need all three checked.
| Counting element | How the Philadelphia count works |
|---|---|
| Data inputs | Restaurant inspections combined with online business searches |
| Scope | Places primarily for on-premise consumption, within city limits |
| Geographic unit | Block groups, with a citywide average of 5 restaurants per block group |
Data inputs. Using both inspection records and online business searches means the count draws on regulated food establishments and on businesses visible in public listings. The fact sheet does not describe how overlapping records were matched or whether one source was weighted over the other, so the method for resolving duplicates cannot be confirmed from the source.
Scope. Only places primarily for on-premise consumption are counted. Places not primarily for on-premise consumption, and establishments outside city limits, fall outside the figures, so the numbers describe the city proper, not the wider metro area.
Geographic unit. Block groups are small areas. Density comparisons between neighborhoods therefore depend on which block groups are grouped together.
Which Philadelphia neighborhoods have the most restaurants?
Philadelphia’s restaurants are concentrated, not spread evenly. The city has just over 6,000 restaurants, and the baseline for neighborhood comparison is a citywide average of 5 restaurants per block group. A block group above that average is denser than a typical block group in the city. The source identifies Center City and University City as the main clusters.
Citywide baseline
| Metric | Value |
|---|---|
| Total restaurants in the city | Just over 6,000 |
| Average restaurants per block group | 5 |
Source: Billy Penn (WHYY), 2019-09-27.
How to rank areas with this data
The unit of measurement is the block group, not an official neighborhood boundary. To rank an area:
- Count restaurants in each block group.
- Compare each count with the citywide average of 5.
- Group adjacent above-average block groups into a corridor or neighborhood.
- Label the result as an estimate, since the boundaries are yours, not the source’s.
What the source cannot rank
The source does not publish totals for named neighborhoods, so any neighborhood ranking built from it is an inference from block-group clustering, not a published league table.
Center City and University City: the dense core
The source data places the heaviest clustering in Center City and University City. The clearest example is one block group of about 0.1 square miles near City Hall, which contains up to 164 restaurants. That is a high count of places in a very small footprint, and it is the main reason the core stands apart in any density comparison.
| Item | Value |
|---|---|
| Example block group area | About 0.1 square miles |
| Example block group location | Near City Hall, Center City |
| Restaurants in that block group | Up to 164 |
| Citywide restaurant total | Just over 6,000 |
| Counting basis | Places primarily for on-premise consumption, within city limits |
| Source | Philadelphia Health Department food access report, as reported by Billy Penn (WHYY), 2019-09-27 |
To compare the core with other neighborhoods:
- Check that the area you are comparing is a block group of similar size, not a larger district.
Fishtown and East Passyunk: why the source cannot measure these corridors
The Billy Penn (WHYY) report from 2019-09-27 gives no restaurant counts for Fishtown or East Passyunk. Its neighborhood-level detail covers Center City and University City, so the source cannot support any claim about how busy these two corridors are.
Why block group data cannot isolate a corridor
The report counts restaurants per block group, a census-defined area. Its figures describe the whole area, not the blocks along a commercial strip. A single block group can include residential side streets next to a busy corridor, so its total mixes high-traffic frontage with quiet blocks.
What a corridor count requires
| Requirement | Status in the report |
|---|---|
| Restaurant records at street-address level | Not given; only block group totals are published |
| Corridor boundaries defined by street segments | Not defined in the source |
| Confirmed on-premise status per place | No per-place breakdown published |
Method to measure a corridor yourself
- Obtain the underlying restaurant records, not the block group summary.
- Geocode each record to a street address.
- Draw a boundary around the corridor, such as a set of street segments, and keep only the addresses inside it.
- Remove duplicates. The report combined inspection records with online searches, so one business can appear twice.
Where are the restaurant gaps?
The clearest pattern in the Philadelphia data is that zero-restaurant block groups are common, and most of them sit outside Center City and University City. The source describes many block groups with no restaurants at all. The citywide average of about 5 restaurants per block group therefore hides a very uneven spread: restaurant counts are concentrated in a few areas, while large parts of the city have none. Read the average as a benchmark, not as a typical block group.
Two residential and one industrial zone stand out in the source:
| Area | Land use | Reported pattern |
|---|---|---|
| Southwest Philadelphia | Industrial | Large gaps |
| Northeast Philadelphia | Residential | Block groups with no restaurants |
| Northwest Philadelphia | Residential | Block groups with no restaurants |
The source does not explain why these gaps exist. Land use may play a part in industrial Southwest Philadelphia, but that is a hypothesis to check against zoning data, not a finding. For the residential Northeast and Northwest, the data cannot show whether residents lack nearby options or whether no businesses operate there.
How to use a gap map
To find gaps yourself, follow these steps:
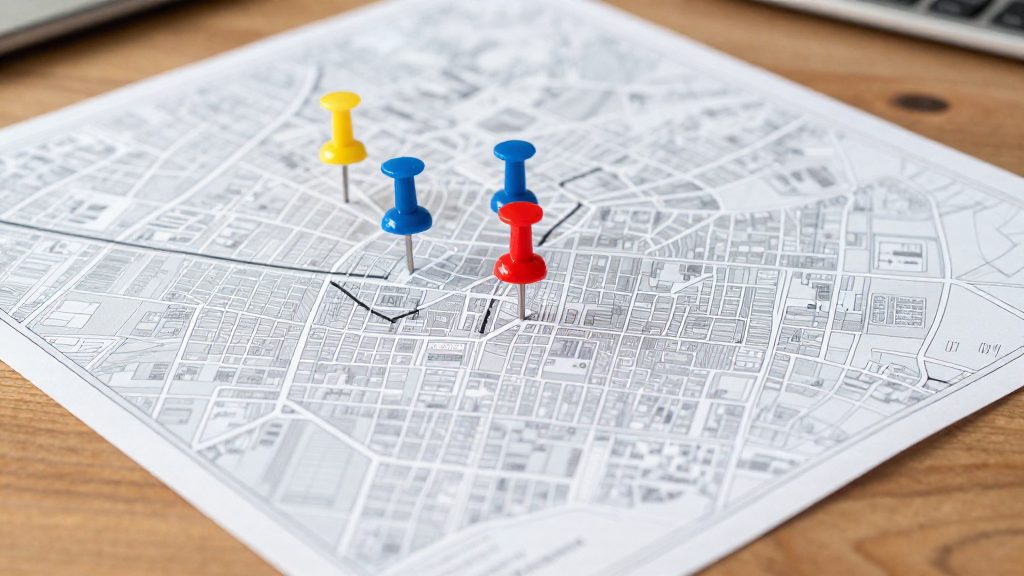
- Map the block groups. Use census block group boundaries as your unit, since the source counts restaurants at this level.
- Mark the zeros. Shade every block group with no restaurants and check whether they cluster in contiguous blocks or are scattered.
- Check land use. Compare zero areas against residential and industrial zoning. An empty industrial block group and an empty residential block group call for different follow-up.
- Add your own criteria. Overlay the zero areas with data you need for daily life, such as grocery access, transit, or housing prices, from separate sources.
Restaurants per capita: Philadelphia vs other cities
Philadelphia ranks second of the five cities compared, with about 3.8 restaurants per 1,000 residents. Only Boston is higher, at 4.3 per 1,000. This ratio divides the restaurant count by population, so it measures restaurant availability relative to city size, not the total number of restaurants.
| City | Restaurants per 1,000 residents | Rank |
|---|---|---|
| Boston | 4.3 | 1 |
| Philadelphia | 3.8 | 2 |
| New York City | 2.8 | 3 (tied) |
| D.C. | 2.8 | 3 (tied) |
| Chicago | 2.5 | 5 |
Philadelphia sits 0.5 below Boston, 1.0 above New York City and D.C., and 1.3 above Chicago. These gaps are simple differences between the published ratios. At Philadelphia’s rate, a city of 100,000 residents would have about 380 restaurants, while the same population at Chicago’s rate would have about 250.
The figures come from a Billy Penn (WHYY) article dated 2019-09-27.
Does density matter when choosing where to live?
Restaurant density is a useful proxy for street-level activity, but it does not decide on its own whether a neighborhood suits you. A high count tells you how many eating places operate in an area. It does not tell you how many people walk past them, how late they stay open, or how loud the block is at night. Use density as one lifestyle signal, combined with housing price and transit access.
The Philadelphia figures come from a Health Department food access report, as covered by Billy Penn (WHYY), 2019-09-27.
Activity versus quiet streets
Dense blocks and residential side streets involve different trade-offs. Dense areas put dining and services within a short walk, but they also bring more pedestrian traffic, deliveries and evening noise. Residential streets are usually calmer, but they offer fewer options nearby. Neither is better in general. The right choice depends on which of these you use every day.
Matching density to daily routines
Test the preference against your actual week, not an idealized one:
- Frequent evening dining: a denser area shortens trips and makes spontaneous plans easier.
- Home cooking and remote work: a quieter block may matter more than the number of venues nearby.
- Early schedules or young children: check late-evening and weekend noise directly.
- Car-free errands: weigh restaurant density alongside grocery and transit access.
Using density with price and transit data
Density works best as one column in a side-by-side comparison of the same neighborhoods. A high-density area that is also expensive can be weighed against a quieter, cheaper area with similar transit access. Each factor answers a different question:
| Factor | What it tells you | Limitation |
|---|---|---|
| Restaurant density | Concentration of on-premise eating places | Counts listings, not foot traffic |
| Housing price | Cost of entry into the area | Says nothing about noise or walkability |
| Transit access | Reach for commuting and car-free travel | Says nothing about evening activity |
Read the three together. Density explains the character of the street, price explains the cost of living there, and transit explains how easily you can reach the rest of the city.
Where to find neighborhood data
The Philadelphia restaurant counts used in neighborhood comparisons come from a Philadelphia Health Department food access report. The Billy Penn (WHYY) article dated September 27, 2019 cites it as the underlying source. Start with the report itself rather than news coverage, because a news article restates totals without showing the counting rules or the geography behind them.
Philadelphia Health Department food access report
- Find the report on the Health Department’s website or by searching its exact title, then confirm it matches the document the WHYY article describes.
- Read the methodology section before using any figures.
Obtaining block group level restaurant counts
The block group is the unit that makes neighborhood-level comparison possible. To reproduce block-group counts:
- Look for a table or attached dataset in the report keyed to block group identifiers, not only to neighborhood names or ZIP codes.
- Join each identifier to US Census block group boundaries so counts can be mapped.
- Recompute the citywide average from your joined data and compare it with the published figure of 5. A mismatch means your boundary set or count scope differs from the report’s.
Checking the 2019 publication date before comparing
The fact sheet dates the coverage to 27 September 2019, so the counts reflect Philadelphia at that time. The report’s own publication date is not given separately, so confirm it before comparing.
- Record the report’s publication date and the reference period of its restaurant counts. These may differ.
- Label the counts as a 2019-era snapshot in any table you publish, so readers do not treat them as current.
Frequently asked questions
Why doesn’t this article rank Philadelphia neighborhoods by restaurant count?
The source gives citywide figures and one Center City example, a block group of about 0.1 square miles near City Hall with up to 164 restaurants. It does not provide corridor-level counts for areas such as Fishtown or East Passyunk, so a neighborhood ranking would need data the source does not contain.
How does Philadelphia’s restaurant density compare with other large US cities?
Philadelphia has about 3.8 restaurants per 1,000 residents, which is second only to Boston at 4.3. New York City and D.C. are at 2.8 and Chicago at 2.5.
Can I use these counts to compare dining options across the whole metro area?
No. The count covers only places primarily for on-premise consumption within city limits, so suburban establishments are excluded. The source also does not explain how records from inspections and online listings were matched to avoid duplicates.