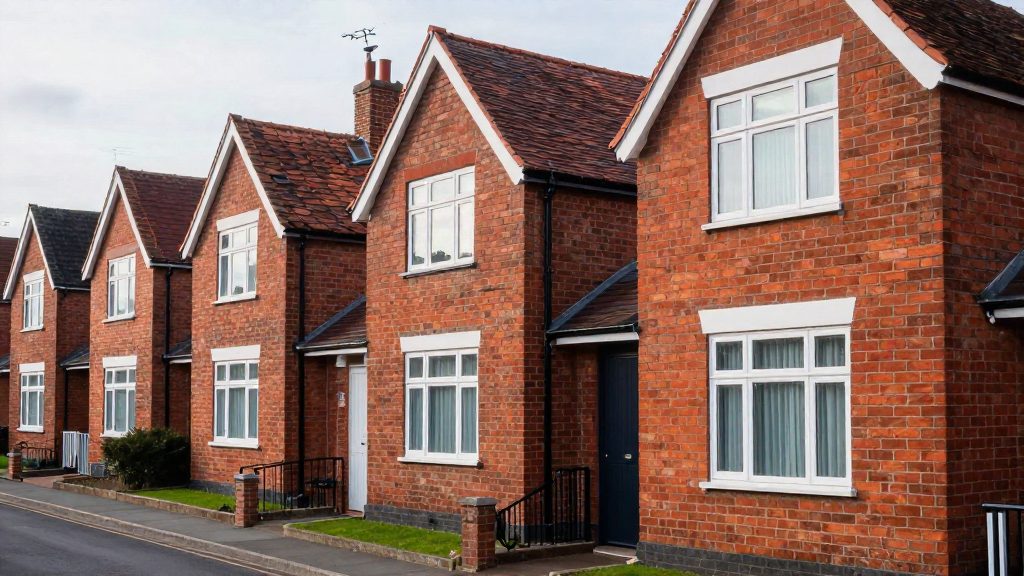
The effective property tax rate is the average residential property tax actually paid, expressed as a percentage of home value for owner-occupied housing. The Tax Foundation uses it because local millage rates are set by each jurisdiction and are not directly comparable across counties. When you compare effective rates, you see what owners pay, not the headline rate printed on a local levy schedule.
Why effective rates beat millage rates
How the effective rate is calculated
The effective rate divides taxes paid by home value. The Tax Foundation’s method (2022 data, published in 2024) uses average residential taxes paid on owner-occupied homes. A second 2024 method, based on American Community Survey (ACS) data, divides the median tax paid by the median home value. Using that method, Lake County, IL is at 2.50% and Maui County, HI at 0.14%. Because the two methods aggregate differently (averages versus medians), figures from different sources should not be mixed in one comparison.
Why millage rates are not directly comparable
Millage rates are set locally, so each county or taxing district expresses its levy on its own basis. A millage rate in one county cannot be read against a millage rate in another without knowing how that county applies it. Assessment ratios, abatements, caps and the split between residential and commercial rates also differ, and they change what owners actually pay. The effective rate absorbs all of these differences into one percentage.
Owner-occupied housing as the measurement basis
Measuring taxes against owner-occupied homes gives a consistent denominator: the home value that the owner’s tax bill is applied to. This keeps the comparison focused on residential property and avoids mixing in commercial rates.
| Measure | Millage rate | Effective rate |
|---|---|---|
| Who sets it | Local taxing authorities | Calculated from taxes paid |
| Unit | Local levy units | Percentage of home value |
| Comparable across counties | No, set locally | Yes, same formula applied to each county |
| Reflects abatements and caps | Not in the headline rate | Yes, through taxes actually paid |
How do property tax rates differ between US counties?
County-level burdens vary much more than the national average suggests. In 2022, the U.S. average county median property tax bill was $1,815, and the distribution around that figure is wide. Some counties have medians above $10,000, while ten counties or equivalents have medians under $250. Because a dollar bill also reflects home values, the effective rate (taxes paid as a percentage of home value) is the better basis for comparing counties with each other.
Counties with medians above $10,000
- Fifteen counties had a median bill above $10,000 in 2022.
- The source names Marin County (CA), seven New Jersey counties and six New York counties.
- Of the 14 counties the source names, 13 are in New Jersey or New York, so the high end is concentrated in a few states.
Counties with medians under $250
- Ten counties or equivalents had a median bill under $250.
- The source does not name them, so this group can only be described by count, not by location.
- A $250 bill is less than one-seventh of the $1,815 national average county median.
Effective rate spread between counties
Using 2024 American Community Survey data (median tax paid divided by median home value), Lake County (IL) has an effective rate of 2.50%, while Maui County (HI) has 0.14%. The first is nearly eighteen times the second. These figures use a different calculation from the Tax Foundation’s effective rate, so they should not be mixed with it in one table.
| Indicator | Figure | Year | Source |
|---|---|---|---|
| U.S. average county median bill | $1,815 | 2022 | Tax Foundation |
| Counties with median above $10,000 | 15 | 2022 | Tax Foundation |
| Counties with median under $250 | 10 | 2022 | Tax Foundation |
| Lake County (IL) effective rate | 2.50% | 2024 ACS | Millionacres |
| Maui County (HI) effective rate | 0.14% | 2024 ACS | Millionacres |
Highest and lowest tax states and counties
Ranked by effective rate (average residential property taxes paid as a percentage of home value), New Jersey had the highest state rate in 2022 and Hawaii had the lowest. The Tax Foundation’s 2022 state figures and the 2024 American Community Survey (ACS) figures agree on the top three states, with Illinois moving to first place in the ACS data.
Highest and lowest state effective rates, 2022 (Tax Foundation, 2024)
| Rank | State | Effective rate |
|---|---|---|
| 1 | New Jersey | 2.08% |
| 2 | Illinois | 1.95% |
| 3 | Connecticut | 1.78% |
| Lowest | Hawaii | 0.26% |
| Lowest | Alabama | 0.36% |
| Lowest | Nevada | 0.44% |
State and county extremes, ACS 2024 (median tax paid divided by median home value)
| Geography | Effective rate | Position |
|---|---|---|
| Illinois | 1.96% | Highest state |
| New Jersey | 1.85% | Second-highest state |
| Connecticut | 1.63% | Third-highest state |
| Hawaii | 0.27% | Lowest state |
| Lake County, IL | 2.50% | Highest county in this set |
| Maui County, HI | 0.14% | Lowest county in this set |
The two tables use different years and different calculations. The Tax Foundation figures are averages of taxes actually paid, while the ACS figures divide a median tax by a median home value. Do not treat a 2022 state rate and a 2024 ACS rate as a direct change over time.
Tax rate versus tax bill: why they differ
A property tax bill is not the same as the rate. As a working approximation, the bill equals the effective rate multiplied by the home’s value. Two owners in the same area pay different bills at the same rate if their homes are valued differently, and a low-rate area can still produce a high bill if home values are high. At the same effective rate, a home valued at twice as much pays roughly twice the tax.
Assessed value and assessment ratios
The value used for the calculation is not always the market price. Local authorities apply an assessment ratio, the share of value on which tax is levied. A lower ratio reduces the bill even when the rate is unchanged.
Abatements and caps
Abatements and caps also change payable amounts without changing the published rate.
- Abatements reduce the amount owed for eligible owners or property types.
- Caps limit how much a bill, or the assessed value, can rise over time.
A bill can therefore sit well below what the headline rate implies, and the gap depends on local rules.
Residential versus commercial rates
Some jurisdictions set different rates for residential and commercial property. Comparing a residential owner’s bill against a commercial rate, or the reverse, misstates the burden. Residential effective rates are the relevant measure for a home buyer.
| Source | Measure | Year | New Jersey | Illinois | Connecticut | Hawaii |
|---|---|---|---|---|---|---|
| Tax Foundation | Effective rate | 2022 | 2.08% | 1.95% | 1.78% | 0.26% |
| Motley Fool (Millionacres), using ACS data | Median tax paid ÷ median home value | 2024 | 1.85% | 1.96% | 1.63% | 0.27% |
The two sources use different methods and years, so their figures should not be mixed in one comparison. New Jersey ranks first in the 2022 figures but second in the 2024 figures, where Illinois is highest.
What drives differences within a state?
Neighboring counties in the same state can show very different property tax burdens because each local government sets its own levy against its own tax base. In Illinois, the 2024 ACS figure for the state is 1.96%, while Lake County stands at 2.50%, so a single county can sit well above its state’s figure.
Overlapping levies
A parcel is usually billed by several taxing bodies at once: school districts, municipalities and special districts such as fire, water or park authorities. Each body sets its own levy, so two homes with the same market value can carry different totals if they fall within different combinations of districts. The full list of taxing districts on a bill, not the county rate alone, shows which levies apply.
Reassessment timing
Effective rates depend on how current assessed values are relative to market prices. A county that reassesses infrequently can carry assessed values that lag behind sales prices, while a county that reassesses often tracks the market more closely. Reassessment schedules are set locally, so the assessor’s calendar shows when a county last updated values before you compare it with a neighbor.
Tax base size
A county with a large commercial and industrial base may spread levies across more assessed value, while a county made up mostly of homes may place more of the burden on residential owners, depending on local rules.
| Driver | Effect on what owners pay | Where to verify |
|---|---|---|
| Overlapping school, municipal and special district levies | Each taxing body adds its own levy to the parcel total | Itemized property tax bill |
| Reassessment timing | Gap between assessed and market value | County assessor’s reassessment schedule |
| Assessment ratios, abatements and caps | Reduce or limit the amount actually paid | County assessor and tax documentation |
| Residential vs. commercial rate split | Shifts the burden between property classes | Local budget and levy documents |

How can you compare counties yourself?
To compare counties, calculate the same ratio for each one, using the same data year and the same property type. The core formula for a county-level estimate is the ACS-based ratio = median tax paid / median home value, expressed as a percentage. It differs from the Tax Foundation’s effective rate, which uses average taxes paid. Applying the ratio to every county puts them on one scale.
- Pull both medians from the same release. Take the median annual property tax paid and the median home value for each county from one dataset, such as the American Community Survey (ACS) table your source uses. Mixing tax figures from one release with home values from another distorts the result.
- Compute the ratio. Divide the median tax paid by the median home value. The 2024 ACS-based figures in the reference data put Lake County, IL at 2.50% and Maui County, HI at 0.14%, which shows the range a single ratio can capture.
- Match counties with FIPS codes. A FIPS code is the standardized numeric county identifier used by federal datasets. Names are unreliable because many counties share them. Store codes as text, since a code with a leading zero loses that digit if a spreadsheet reads it as a number.
- Hold property type constant. The reference definition covers owner-occupied housing. Compare residential owner-occupied figures only, and exclude commercial property, which may be taxed at different rates.
- Hold the survey year constant. Compare only counties from the same survey year. The reference data includes 2022 state figures from the Tax Foundation and 2024 ACS county figures, which are different series.
| Constraint | What to match | Why it matters |
|---|---|---|
| Formula | Median tax paid / median home value | Keeps the ratio comparable |
| Identifier | FIPS code, stored as text | Avoids mismatched or merged counties |
| Property type | Owner-occupied residential | Excludes commercial rates |
| Year | Same survey year | Removes timing differences |
Which data sources should you trust?
This guide draws on three types of sources, and each measures something different. The effective rate from the Tax Foundation is the most comparable across states, because it divides the residential property taxes actually paid by the value of owner-occupied homes.
The Tax Foundation’s figures are published with a lag. The state ranking cited for 2022 comes from a 2024 publication, so a comparison made in 2026 uses rates that are about four years old. Check the data year before comparing a figure with current listings or recent bills.
The American Community Survey provides a second view. The 2024 ACS-based rates reported by Millionacres are calculated as median tax paid divided by median home value. This is a ratio of two medians, not an average of individual homeowners’ rates, so it can differ from the Tax Foundation’s effective rate for the same county. Use it to check direction and rough order, not to replace the other sources.
Assessor and treasurer records are the primary sources for a specific county. The assessor sets assessed values and the treasurer’s office records the bills issued. These records capture what the Tax Foundation and ACS figures smooth out, including exemptions, caps, abatements and any difference between residential and commercial rates.
| Source | What it measures | Limitation | Data year in fact sheet |
|---|---|---|---|
| Tax Foundation | Effective residential rate (taxes paid ÷ home value) | Published with a lag | 2022 figures, 2024 publication |
| ACS-based ratio (Millionacres) | Median tax paid ÷ median home value | Ratio of medians, not an average rate | 2024 ACS data |
| Assessor and treasurer records | Assessed values and bills issued | Collected county by county | Not stated in fact sheet |
Is a low property tax rate always better?
A low effective rate does not automatically make a place better to live. Hawaii (0.26% in 2022) and Alabama (0.36%) rank among the lowest states, while New Jersey (2.08%) and Illinois (1.95%) rank highest. The rate alone does not show what residents receive in return or what they pay overall, so three factors need to be weighed together.
- Low rates can come with fewer services. Property tax revenue funds local services. A low rate may therefore coincide with less funding for schools, roads, or other public services. Check the county budget to see what the tax pays for.
- High rates are often tied to local spending. Local property taxes are commonly used for schools and infrastructure. Illinois at 1.96% (2024 ACS-based estimate) and Lake County, IL at 2.50% show that high rates can be concentrated at the county level. A high rate does not by itself show what is being financed or whether the area is good or bad; the county budget shows what the tax pays for.
- Home prices change the total cost. The tax is a percentage of home value, so the same rate produces very different bills. The U.S. average county median bill was $1,815 in 2022, but Marin County, CA was among the 15 counties with medians above $10,000. The total ownership cost depends on the rate and the home price together.
| Area | Effective rate | Basis |
|---|---|---|
| Hawaii (state) | 0.26% | Tax Foundation, 2022 |
| Maui County, HI | 0.14% | 2024 ACS-based estimate |
| Illinois (state) | 1.95% | Tax Foundation, 2022 |
| Illinois (state) | 1.96% | 2024 ACS-based estimate |
| Lake County, IL | 2.50% | 2024 ACS-based estimate |
Frequently asked questions
Why can’t I compare millage rates directly between counties?
Each county or taxing district sets its millage rate on its own basis, and assessment ratios, abatements and caps change what owners actually pay. A millage rate therefore doesn’t show the cost of ownership on its own. The effective rate converts these differences into a single percentage of home value.
Why do two sources give different effective rates for the same county?
The Tax Foundation averages individual tax bills, while the ACS-based method divides the median tax paid by the median home value. Lake County, IL, for example, appears at 2.50% under the ACS method, but that figure can’t be placed next to Tax Foundation averages. Use one method throughout a comparison, and check the data year, since Tax Foundation figures cover 2022.
Does a lower effective rate mean a lower property tax bill?
Not necessarily. A low effective rate can still produce a large bill in a county with expensive homes, because the dollar amount depends on home values. The rate shows the share of value paid each year, so use it to compare burden across places, and use the dollar median to estimate what a typical owner pays.