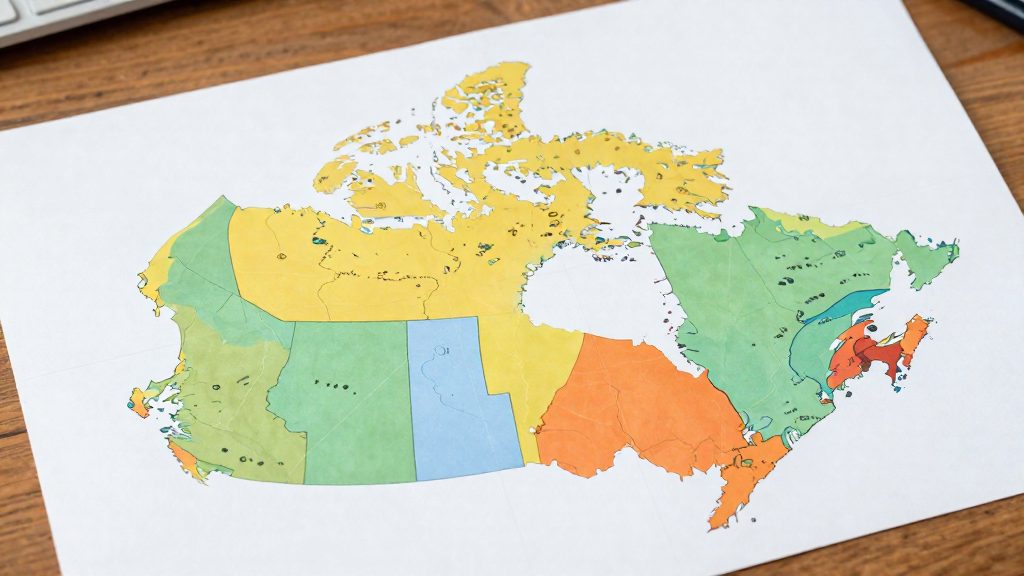
Comparing natural hazard risk across Canadian provinces draws on two federal sources that answer different questions. The National Risk Profile, released by the federal government on 11 May 2023, is Canada’s first national-level disaster risk assessment. A 2014 Statistics Canada survey measures something else: how likely residents believe each hazard is in their own community. Reading the two together shows where formal risk analysis and local perception differ, and why one province’s hazard mix can look very different from its neighbour’s.
Why compare perceived natural hazard risks by province?
What the National Risk Profile covers
- Release: 11 May 2023, according to The Weather Network (2023).
- Hazards covered: earthquakes, wildland fires, floods and pandemics.
- Next component: heat events, hurricanes and space weather, according to The Weather Network (2023).
Because heat and hurricanes are not yet in the national profile, any province comparison involving those hazards has to come from other sources. Comparisons of the four covered hazards can start from the profile itself.
What the 2014 perception survey measured
Statistics Canada (2015) reports a 2014 survey that asked residents whether specific hazards were likely in their community. The results therefore describe perceived likelihood, not modelled exposure or recorded events. The official sources consulted do not specify the sample size or sampling method for this survey, so the figures should be read as community-level impressions.
Why the hazard mix differs across provinces
The 2014 survey found that perceived risk of several hazards varied strongly by region:
| Hazard | Province | Share who thought it likely (2014) |
|---|---|---|
| Hurricanes | Nova Scotia | 74% |
| Droughts | Saskatchewan | 73% |
| Tornadoes | Saskatchewan | 68% |
| Heat waves | Quebec | 63% |
| Landslides or avalanches | British Columbia | 35% |
Saskatchewan appears twice, for drought and tornadoes, while the Atlantic and Quebec entries point to different hazards entirely. This is the core reason a single national ranking is not enough. A province’s hazard mix is the combination of hazards its residents face, and that combination is what a comparison has to capture.
Earthquakes: where is the risk highest?
The National Risk Profile, released by the federal government in May 2023, estimates that expected direct losses from a large earthquake could reach $75 billion across Canada. This is a national figure. The sources consulted do not break it down by province, so it cannot be used to rank provinces by financial exposure.
To compare provinces, the only province-level earthquake indicator available is perceived likelihood: the share of residents who believed an earthquake was likely in their community. Statistics Canada (2015) reported these results from a 2014 survey:
| Province | Share who thought an earthquake was likely |
|---|---|
| British Columbia | 77% |
| Quebec | 63% |
| Newfoundland and Labrador | 7% |
| Manitoba | 6% |
Among the provinces reported, British Columbia and Quebec show the highest perceived likelihood, while Newfoundland and Labrador and Manitoba show the lowest. The gap is large, with British Columbia at 77% and Manitoba at 6%.
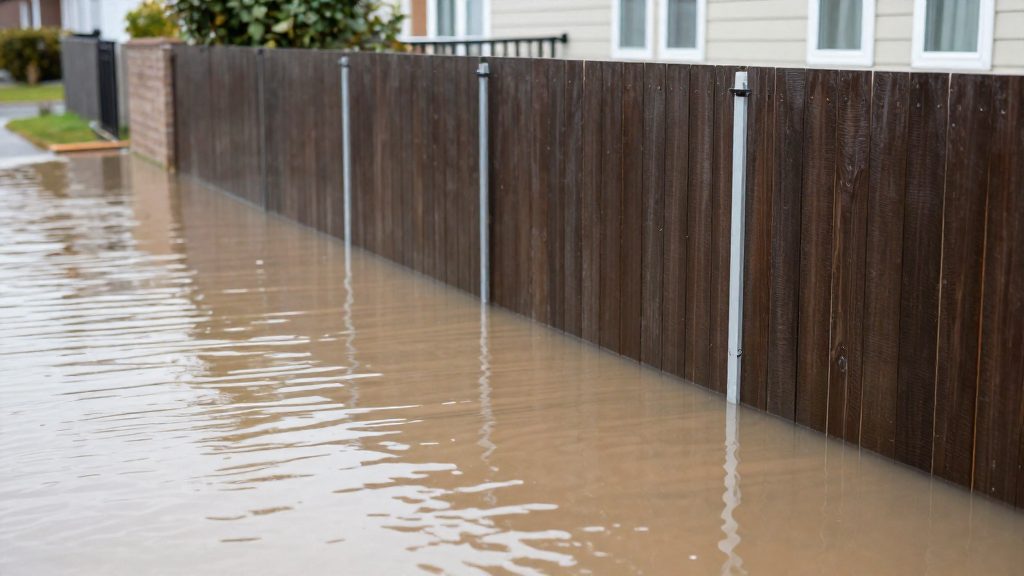
Floods across Canada
The 2014 Statistics Canada survey measured how residents perceived flood risk in their own community, and the answers varied widely by province. Manitoba had the highest share, with 65% of Manitobans saying a flood was likely where they lived. Prince Edward Island had the lowest, at 35%. The gap between the two is 30 percentage points.
| Province | Share who thought a flood was likely in their community (2014) |
|---|---|
| Manitoba | 65% (highest) |
| Prince Edward Island | 35% (lowest) |
The official sources consulted do not specify province-level flood exposure figures. Residents’ views can reflect recent local events, media coverage or direct experience, and these factors do not always match hazard data.
To compare flood risk between two places, use perception scores as a starting point, then check the measured exposure. Look for flood-zone maps published by the municipality or province, and confirm whether a specific address sits near a watercourse or in a low-lying area.
Wildfires and smoke by region
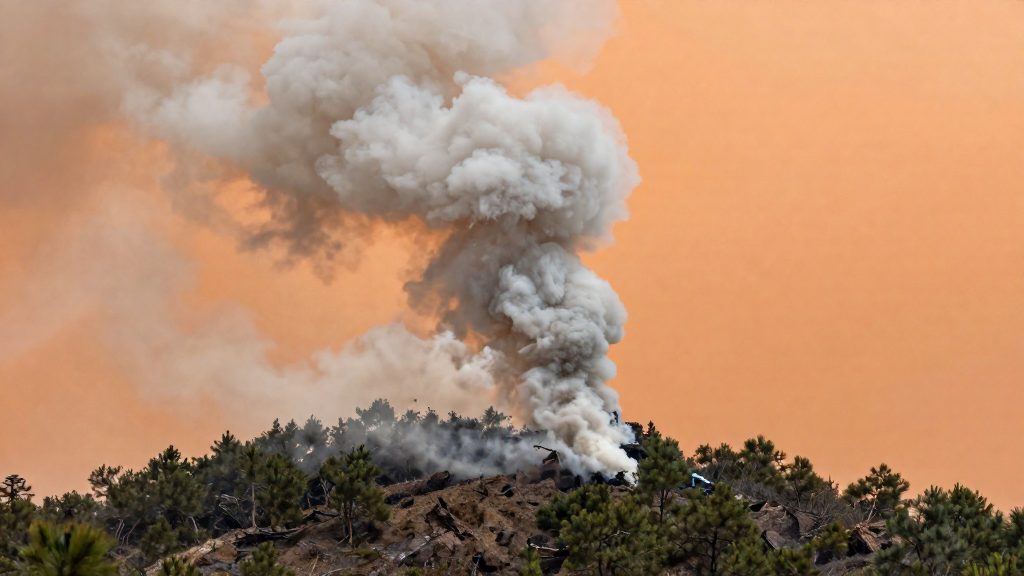
Wildfire risk comparisons between Canadian provinces rest on two different measures: how residents perceive the risk, and how much land actually burns. These are two distinct measures, and the sources consulted do not allow them to be compared directly. Burned area is given only as a national trend, while the perception figures are given by province.
According to Statistics Canada (2015), perceived wildfire risk in a 2014 survey was highest in New Brunswick (64%), followed by Newfoundland and Labrador (61%), Nova Scotia (61%) and British Columbia (59%). Ontario was lowest at 23%.
The National Risk Profile, released by the federal government on 11 May 2023 and reported by The Weather Network (2023), gives the national picture. The area burned by wildland fires each year has more than doubled since the 1970s and could double again by 2100. The official sources consulted do not specify regional burned-area breakdowns for these figures, so the trend cannot be assigned to individual provinces from this material.
For a regional comparison, use the following method:
- Compare the perception scores in the table below with the burned-area data published for each province by its wildland fire agency.
- Check whether a province’s perceived risk is high because of recent fire seasons or because of population density and visibility of forest edges.
- For smoke exposure, review provincial or federal air quality advisories for the months when fires are active, since smoke can travel well beyond the province where a fire starts.
| Province | Perceived wildfire risk (2014 survey) |
|---|---|
| New Brunswick | 64% |
| Newfoundland and Labrador | 61% |
| Nova Scotia | 61% |
| British Columbia | 59% |
| Ontario | 23% |
Storms, heat and hurricanes
This section compares how residents perceive four weather-driven hazards across Canadian provinces: hurricanes, heat waves, tornadoes and droughts. The figures come from a 2014 survey by Statistics Canada (2015), which asked respondents whether each hazard was likely in their community.
Perceived risk by hazard and province
| Hazard | Province | Share who considered it likely (2014) |
|---|---|---|
| Hurricanes | Nova Scotia | 74% |
| Droughts | Saskatchewan | 73% |
| Tornadoes | Saskatchewan | 68% |
| Heat waves | Quebec | 63% |
Nova Scotia has the highest figure in this group, at 74% for hurricanes. Saskatchewan appears for both the drought figure (73%) and the tornado figure (68%) among the figures reported. Quebec’s 63% for heat waves is the figure reported for that hazard in the 2014 survey.
Reading the differences between hazards
A province’s ranking changes from one hazard to the next. Saskatchewan’s high values for droughts and tornadoes are specific to those hazards. The hurricane figure reported in the source is Nova Scotia’s 74%, and the sources do not explain why perceptions differ. Comparing provinces therefore requires looking at each hazard separately rather than averaging them into a single score.
Limits of the current national data
The official sources consulted do not yet provide a national, province-level assessment of these four hazards.
How do you check risk for a specific city or neighbourhood?
National assessments describe broad patterns and do not give a verdict for one address. To assess a specific location, work through three official layers, from the largest scale to the smallest.
- Seismic hazard lookup. Natural Resources Canada publishes seismic hazard information that can be queried by location. Enter the address or coordinates, if the tool accepts them, and record the hazard value shown for that point. Repeat the lookup for two or three nearby points to see whether the value changes across the neighbourhood.
- Municipal flood maps and zoning. Flood exposure is usually recorded at municipal level. Use the city’s planning or zoning portal to find the floodplain designation for the parcel. Read the bylaw linked to that designation, because it sets the rules that apply to construction and renovation. Confirm that the map is the current version, since older maps may have been replaced.
- Provincial wildfire risk maps. Each province publishes its own wildfire risk mapping and hazard classifications. Find the hazard zone class that covers the address and read the legend, since class names and definitions are set by each province and cannot be compared directly across provincial borders.
The three layers answer different questions, so they should not be merged into one score.
| Layer | Publisher | What to record | Main limitation |
|---|---|---|---|
| Seismic hazard | Natural Resources Canada | Hazard value at the address and nearby points | National-scale model; it does not describe site-specific ground conditions |
| Flood zone | Municipality | Floodplain designation on the parcel and the linked bylaw | Coverage and map currency vary by municipality |
| Wildfire hazard | Provincial government | Hazard zone class and its legend definition | Class definitions differ from one province to another |
What the data can’t tell you
The 2014 Statistics Canada survey measures what residents believed about local hazards at that time. It does not measure current risk. The federal government released the National Risk Profile on 11 May 2023 as the first national-level disaster risk assessment, so the two sources answer different questions and should not be read as interchangeable.
For a decision about where to live, the relevant measures are modelled frequency and consequences. The Profile supplies one such consequence figure: expected direct losses from a large earthquake could reach $75 billion (The Weather Network, 2023).
Provincial averages hide local variation. A province-level figure combines municipalities, towns and rural areas that may face very different exposure. The official sources consulted do not specify how the 2014 results break down below province level, so a single provincial percentage cannot confirm the risk in a particular city or neighbourhood. Use provincial and municipal data for the specific place you are comparing, and treat the survey as context rather than a ranking.
| Source | What it measures | Main limit for local decisions |
|---|---|---|
| Statistics Canada survey (2014 data, published 2015) | Residents’ perceived likelihood of hazards, by province | Not a probability; predates the 2023 Profile |
| National Risk Profile (released 11 May 2023) | Federal assessment of earthquakes, wildland fires, floods and pandemics, including loss estimates | Excludes heat, hurricanes and space weather for now |
Frequently asked questions
Does the National Risk Profile show which province has the highest disaster risk?
The National Risk Profile, published on 11 May 2023 according to The Weather Network (2023), is a national-level assessment, so it does not rank provinces against each other. Its $75 billion estimate for expected direct losses from a large earthquake is a national figure with no provincial breakdown.
Why do the 2014 survey results not match the federal risk findings?
The 2014 Statistics Canada survey measured perceived likelihood, meaning how likely residents believed each hazard was in their community, rather than modelled exposure or recorded events (Statistics Canada, 2015). The official sources consulted do not explain why perception differs between provinces.
Can I compare heat and hurricane risk between provinces using federal data?
Not with the National Risk Profile, which does not yet cover heat events or hurricanes, and will add them in a future component (The Weather Network, 2023). The only provincial figures are from the 2014 survey, such as 74% perceived hurricane likelihood in Nova Scotia and 63% for heat waves in Quebec, and the official sources consulted do not confirm that Quebec’s heat figure is the highest in the country.