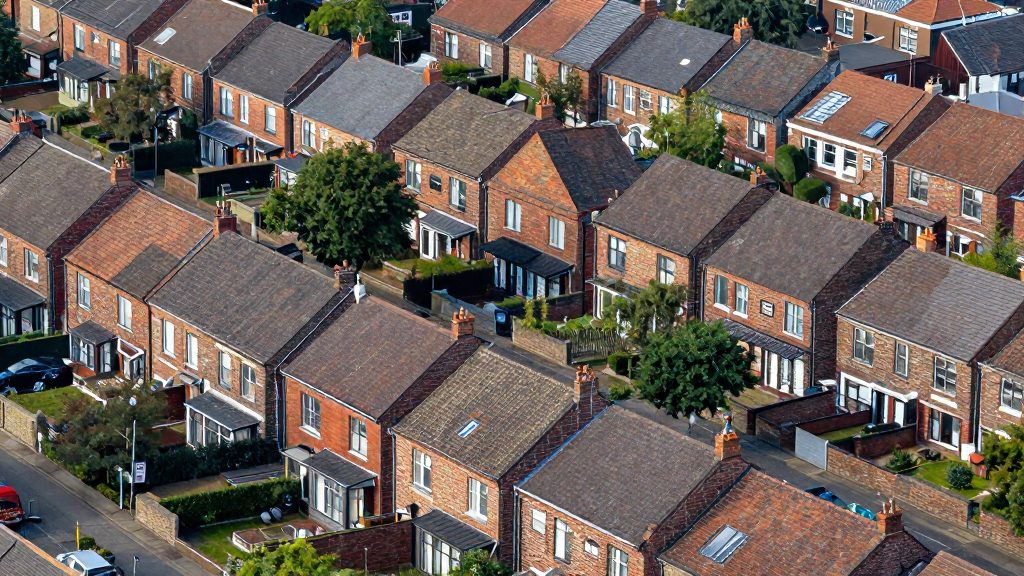
Counties are useful for comparison because they have consistent boundaries and published population and land-area totals, but a single county density figure is an average. In 2020, Suffolk County averaged about 1,618 people per square mile, yet that number covers 911.17 square miles of land, and an average cannot show how the population is distributed within it. Two places with the same county figure can feel very different to live in.
Why county density hides big differences
A county density figure divides total population by total land area. The result is a single average that cannot show where people actually live. Suffolk County is the clearest example in the fact sheet: 1,474,273 residents spread across 911.17 square miles of land produce roughly 1,618 people per square mile, but the county’s population is not evenly distributed across that land.
Averages mix urban and rural land. A county with both a built-up core and large low-density areas will show a middle value that fits neither. Nassau County, by contrast, had about 4,749 people per square mile in 2020 on 284.54 square miles of land, a figure that reflects a much more densely settled area overall. Comparing Nassau’s 4,749 with Suffolk’s 1,618 tells you about the county averages, not about the streets, neighborhoods, or town centers within them.
The calculation method matters. Density is population divided by land area, so the denominator determines the result:
- Density = population ÷ land area in square miles
- Use land area, not total area that includes water, to get a residential density comparable across places
- Check that the population and land figures come from the same year and the same boundary
Municipal density differs from county density. A village, town, or city within a county can have a density far higher or lower than the county average. To estimate it, take the municipality’s own population and its own land area, then apply the same formula. New York City shows the spread: the city as a whole averaged about 27,469 people per square mile in 2020, while Manhattan reached about 71,151 and Staten Island about 8,263.
How dense are the suburbs near New York City?
In 2020, New York City averaged about 27,469 people per square mile, according to the New York State Department of Health. Measured against that figure, every suburban county in the set is far less dense. Nassau ranks first at about 4,749 people per square mile, followed by Westchester (about 2,242), Rockland (about 1,881), Suffolk (about 1,618), and Putnam (about 428). The density gap between the city and its densest suburb is therefore roughly 22,700 people per square mile, and between the city and its least dense county it is about 27,000.
| Rank | County | Density (people per sq mi, 2020) | Gap vs. NYC (27,469) | Share of NYC density |
|---|---|---|---|---|
| 1 | Nassau | 4,749 | 22,720 lower | about 17.3% |
| 2 | Westchester | 2,242 | 25,227 lower | about 8.2% |
| 3 | Rockland | 1,881 | 25,588 lower | about 6.8% |
| 4 | Suffolk | 1,618 | 25,851 lower | about 5.9% |
| 5 | Putnam | 428 | 27,041 lower | about 1.6% |
Gap and share columns are calculated from the density figures above; the density values are the reported 2020 numbers.
Reference points: Staten Island and Manhattan
Two other figures from the same source place the suburban counties in context:
- Staten Island (Richmond): about 8,263 people per square mile, roughly 30% of the city-wide average. Nassau, the densest suburban county, sits at about 57% of this figure.
- Manhattan (New York County): about 71,151 people per square mile, about 2.6 times the city-wide average and about 15 times Nassau’s density.
The spread is wide. Manhattan sets the upper bound, Staten Island sits within the city, and all five suburban counties fall below Staten Island. Among suburbs, the density drop from Nassau to Putnam is steep, which makes the choice of county a strong factor in how built-up a surrounding area feels.
Nassau vs. Westchester: why Nassau is about 2.1 times denser
Nassau County is considerably denser than Westchester County. In 2020, Nassau had about 4,749 people per square mile, compared with about 2,242 in Westchester, according to the New York State Department of Health. Nassau therefore had roughly 2.1 times Westchester’s population density.
The gap comes from two inputs: how many people live in each county and how much land area each covers. Nassau’s estimated 1,351,334 residents live on 284.54 square miles of land. Westchester’s 965,802 residents live on 430.72 square miles, about 146 square miles more than Nassau. Westchester’s larger territory spreads its population more thinly, even though its total population is smaller.
| Measure (2020) | Nassau County | Westchester County |
|---|---|---|
| Residents | 1,351,334 (estimated) | 965,802 |
| Land area (sq mi) | 284.54 | 430.72 |
| Density (people per sq mi) | about 4,749 | about 2,242 |
The density ratio is the Nassau figure divided by the Westchester figure: 4,749 ÷ 2,242, or about 2.12. Because Nassau’s population is an estimate, the ratio is only as precise as that estimate.
Long Island suburbs: Nassau vs Suffolk
Nassau and Suffolk are the two counties of Long Island’s suburban ring. Their main difference is land area: Suffolk covers more than three times Nassau’s ground.
| Metric (2020) | Nassau County | Suffolk County |
|---|---|---|
| Residents | 1,351,334 | 1,474,273 |
| Land area | 284.54 sq mi | 911.17 sq mi |
| Density | about 4,749 per sq mi | about 1,618 per sq mi |
Suffolk: more residents, far more land
Suffolk had about 1,618 people per square mile in 2020, across 911.17 square miles. It had slightly more residents than Nassau. County-level figures cannot show how density changes from Suffolk’s western towns to its eastern ones, or how much of the county is low-density land.
Nassau: compact footprint
Nassau had about 4,749 people per square mile in 2020, roughly 2.9 times Suffolk’s figure. Its smaller land area holds almost as many residents as Suffolk, which explains the gap in density.
Population growth across both counties
The fact sheet covers 2020 only, so it cannot show which county grew faster. To compare growth, take each county’s resident count at two dates and calculate the growth rate: (later count − earlier count) ÷ earlier count × 100. Then check whether the change is large enough to shift density given each county’s land area.
New Jersey and Connecticut suburbs compared
The data provided covers only New York counties, so this section cannot give verified per-square-mile figures for Bergen County, New Jersey, or Fairfield County, Connecticut. Comparing them requires applying the same method used for the New York counties.
Bergen County and Fairfield County are the usual out-of-state counterparts to the New York suburbs. Bergen lies across the Hudson River from Manhattan, and Fairfield borders Westchester County to the east.
Method for an out-of-state comparison
Cross-state commuter links
Commuter rail is the main reason these counties are compared with New York. Cross-state commuter rail services include:
- Metro-North Railroad, whose New Haven Line serves Fairfield County stations and runs to Grand Central Terminal in New York City.
- NJ Transit, whose commuter lines serving Bergen County run through Secaucus Junction toward New York Penn Station.
Comparing density alongside these rail links shows which out-of-state suburbs sit closest to New York transit, which matters for commute-based location choices.
Is lower density always cheaper?
Lower density does not reliably mean lower housing costs. Across the suburban counties around New York City, density is one variable among several, and its link to price depends on what is being bought: a detached house on a large lot, a townhouse, or a condominium. Testing the claim means separating the density effect from other drivers of price, such as commuting access and local tax levels, which this article does not quantify.
How to test the claim
- Median sale price by county: Take recorded sales over a fixed period, split them by property type, and use the median rather than the average. A small number of high-value sales can pull the average far from the typical transaction.
- Price per square foot: Divide each sale price by the home’s living area. Compare the result with each county’s density. If density drives cost, price per square foot should fall as density falls. A weak or flat relationship means density explains little of the price difference.
- Lot size and single-family share: Low-density counties often have larger lots and more detached homes. Both features raise the price of a property without changing its density, so a county can be low density yet expensive per square foot.
What the comparison should show
| Measure | What it tests | Pattern if density drives cost |
|---|---|---|
| Median sale price | Typical purchase price | Lower in lower-density counties |
| Price per square foot | Cost per unit of living space | Lower in lower-density counties |
| Average lot size | Land included in a sale | Larger in lower-density counties |
| Single-family share | Mix of detached housing | Higher in lower-density counties |
When the median price falls but the price per square foot does not, the lower total reflects smaller homes rather than cheaper space. This is one way the “low density, low cost” assumption can fail in a comparison.
How density affects commuting and transit
Density shapes commuting mainly through the transit frequency a county can sustain. Rail and bus services need enough riders within walking distance of each stop to justify frequent departures, so lower-density suburbs usually offer fewer and less frequent services than denser ones. The fact sheet gives 2020 density figures for Nassau, Westchester, Rockland, Suffolk and Putnam counties, but it contains no timetables, commute durations or mode-share data. This section therefore describes how to measure those factors rather than quoting them.
Lower-density counties generally show higher car dependence. When homes are spread over larger areas, the distance from a door to the nearest stop grows, and a car becomes the practical choice for most trips. Comparing counties means checking the same three indicators for each one:
| Indicator | What to check | Why it matters |
|---|---|---|
| Rail and bus frequency | Published departures per hour at peak and off-peak times, by county stop list | Shows whether transit is a usable daily alternative |
| Average commute time | Mean one-way travel time reported for residents | Combines the effects of distance and travel mode |
| Mode share | Share of commuters driving, using transit or walking | Shows how much car ownership is actually needed |
Work through the comparison in this order:
- Collect the transit timetables for each county and count peak-hour departures from the stops closest to residential areas.
- Compare the mode-share split for each county, looking at how many commuters drive compared with how many use transit.
- Check whether lower-density areas have stops within walking distance of most homes. If they do not, expect car ownership to be higher there.
Car ownership rates should be read alongside mode share. A county with weak transit service and a high share of solo drivers is likely to have more vehicles per household, but confirm this against the county’s own data before drawing conclusions.
Where to find the latest density data
The 2020 figures in this comparison come from New York State Department of Health datasets, which publish county population, land area, and density side by side.
Official sources for county population
- US Census Bureau county population estimates: the federal reference for county counts. Use the decennial census for official 2020 counts and the annual estimates programs for later years.
- New York State Department of Health: the source of the county density values used here, including Nassau (about 4,749 per square mile), Westchester (about 2,242), Rockland (about 1,881), Suffolk (about 1,618), and Putnam (about 428).
Land area definitions
Census-based land area counts only dry land and excludes water bodies such as bays, sounds, and large lakes. This matters for coastal counties. Suffolk, for example, covers 911.17 square miles of land, a figure that already excludes its surrounding waters.
Verification method
- Take the population and land area for one county from the same table.
- Divide population by land area. For Nassau: 1,351,334 ÷ 284.54 ≈ 4,749 people per square mile, which matches the published value.
Frequently asked questions
Does a county’s density figure show how crowded my own town is?
No. A county average spreads the population across all of the county’s land, so it is a benchmark for the whole county rather than a measure of any single town. For Suffolk County, about 1,618 people per square mile describes the county as a whole, and a specific town needs its own population and land figures.
How do I calculate density for a place myself?
Divide the population by the land area in square miles, excluding water. Nassau County’s 1,351,334 residents on 284.54 square miles of land give about 4,749 people per square mile. The same method works for a town, as long as you use that town’s boundary.
Which county near New York City is the most densely settled?
Among the counties in the fact sheet, Nassau County is the densest, at about 4,749 people per square mile in 2020. Westchester (about 2,242) and Rockland (about 1,881) follow, then Suffolk (about 1,618), with Putnam far lower at about 428. For scale, Manhattan had about 71,151 people per square mile in the same year.