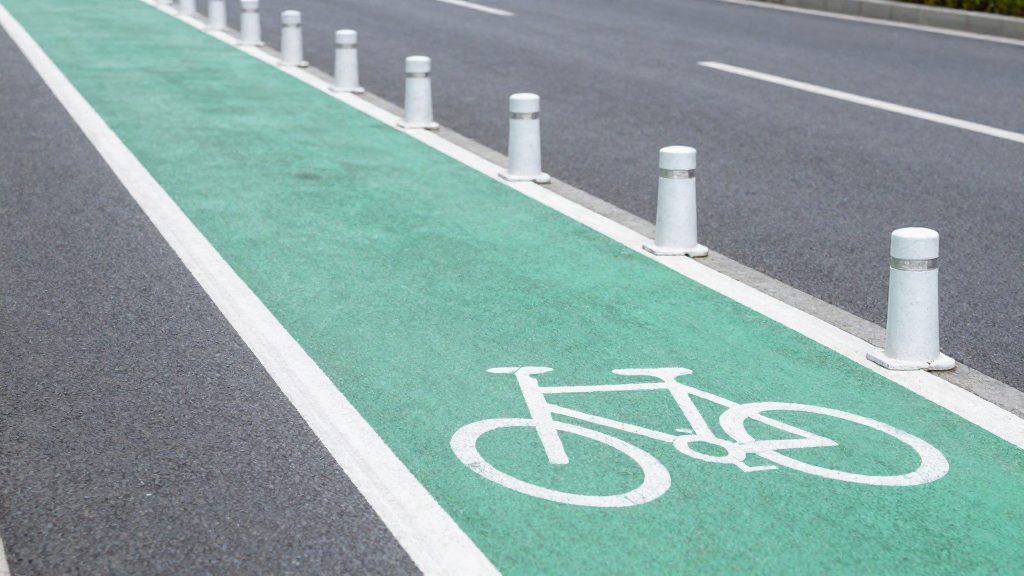
Bike lane networks are hard to compare because cities define, measure, and date their infrastructure differently. The same city can appear larger or smaller depending on whether painted lanes count, whether figures are in miles or kilometers, and which year the data covers. In 2017, according to the Georgia Straight, citing the Sightline Institute, Vancouver had about 16 miles (≈26 km) of protected bike lanes, against 14 miles in Seattle and 6 miles in Portland.
Why bike lane networks are difficult to compare
The first obstacle is definitional. A protected bike lane is physically separated from motor traffic, while a painted lane has no physical barrier. Shared streets and greenways may or may not appear in a city’s headline total. A city that reports all of these together will look larger than one that counts only separated lanes.
The second obstacle is units. Lengths are published in miles or kilometers, so figures must be converted to one unit before any ranking. The Georgia Straight, citing the Sightline Institute (2017), reported the following protected-lane lengths:
| City | Protected bike lanes, 2017 (as reported) |
|---|---|
| Vancouver | About 16 miles (≈26 km) |
| Seattle | 14 miles |
| Portland | 6 miles |
The third obstacle is size. Raw length favors large cities. The same source gives Vancouver an area of 115 km² and ranks it first on infrastructure density. To compute density yourself, divide protected lane length by city area, using the same unit system for both. Density figures for Seattle and Portland require their areas from the same official source and year, so a comparison built on mismatched boundaries will not hold up.
The fourth obstacle is timing. The figures above are a 2017 snapshot, and networks change from year to year. Check the publication date and use the most recent municipal report before drawing conclusions.
What protected bike lane data is available for Canadian cities?
The only protected bike lane figures available for this comparison come from a 2017 analysis. According to the Georgia Straight, citing the Sightline Institute (2017), Vancouver had about 16 miles (≈26 km) of protected bike lanes that year, compared with 14 miles in Seattle and 6 miles in Portland. The official sources consulted do not provide equivalent figures for other Canadian cities, so this section cannot yet rank them.
| City | Protected bike lanes (2017) | Approximate length |
|---|---|---|
| Vancouver, BC | 16 miles | ≈26 km |
| Seattle, WA (US, reference) | 14 miles | ≈23 km |
| Portland, OR (US, reference) | 6 miles | ≈10 km |
Vancouver covers 115 km². Dividing its 26 km of protected lanes by that area gives about 0.23 km of protected lane per km² of city land. This is a simple calculation from the two figures above, not a reported density metric, and it ignores how lanes are distributed within the city.
To compare Canadian cities with current data, use the following method:
- Define “protected” consistently. Count only lanes with physical separation (bollards, curbs, or raised barriers), and exclude painted-only lanes.
- Use municipal sources. Check each city’s open data portal or transportation department for the latest network inventory and its publication date.
- Normalize by area. Compare lane kilometres per km² of municipal area, because raw totals favour larger cities.
- Record the reference year next to every figure so readers can see how old each count is.
Vancouver as a reference case: how to read its figures
Comparing bike lane networks starts with one measure: the length of protected bike lanes, which are physically separated from motor traffic. Painted lanes without a physical barrier are a different category, and combining the two inflates totals. The data available for this section covers only Vancouver, so this comparison uses Vancouver as the reference case and shows how to read its figures.
In 2017, Vancouver had about 16 miles (≈26 km) of protected bike lanes. According to the Georgia Straight, citing the Sightline Institute (2017), Seattle had 14 miles and Portland had 6 miles in the same period. The same analysis ranked Vancouver first for cycling infrastructure density, measured against its land area of 115 km².
The available data does not cover Montréal or Toronto, so their networks cannot be ranked against Vancouver here. To make a like-for-like comparison, apply these steps to each city:
- Confirm the definition. Record protected lanes, painted lanes and shared streets separately.
- Note the measurement year. The Vancouver figures date from 2017 and may not reflect later construction.
- Normalize by area. Divide protected lane kilometres by city land area in km². Using the 2017 figures, Vancouver works out to roughly 0.23 km of protected lane per km² (26 ÷ 115).
- Use the same benchmark cities for every comparison, so differences reflect the networks rather than the choice of peers.
Kilometres per Inhabitant or per km²?
Absolute network length favours large cities, so a fair comparison divides length by a denominator. Per capita (length ÷ population) shows how much network each resident has access to. Per km² (length ÷ land area) shows how densely the network covers the city’s surface. The two measures can rank cities differently, so choose the one that matches your question.
The most specific comparison in the sources consulted dates from 2017. According to the Georgia Straight (2017), citing the Sightline Institute, Vancouver had about 16 miles (≈26 km) of protected bike lanes, compared with 14 miles in Seattle and 6 miles in Portland. The same reporting gives Vancouver a land area of 115 km² and presents the city as leading on infrastructure density.
Limits of this comparison
- The sources consulted give no population figures, so a per-capita ratio cannot be calculated for any of the three cities.
- Land areas for Seattle and Portland are not given, so a per-km² comparison is possible only for Vancouver.
- The counts cover protected lanes only, not painted or shared lanes.
Method for building your own ratio
- Use the same unit (miles or km) and the same year for every city.
- Divide network length by population and by land area, using the same boundary for both (city proper or metro area).
- Record the source and date of each figure before comparing results.

Winter: what to check before judging how usable a bike network is
The sources consulted for this comparison do not report winter maintenance data for Vancouver, Seattle, or Portland, so this section cannot rank the cities on winter usability. The only network figures available are from 2017: according to Georgia Straight, citing the Sightline Institute (2017), Vancouver had about 16 miles (≈26 km) of protected bike lanes, against 14 miles in Seattle and 6 miles in Portland. Those numbers measure network length, not whether the lanes are cleared after snowfall, so they do not show winter performance.
To judge winter usability for any Canadian city, check three things:
- Clearing priority: whether protected lanes appear in the municipal snow-clearing plan, and in what order they are cleared relative to arterial roads.
- Clearing method: whether lanes are plowed separately from the car lanes or left to the general street crew, since a plowed car lane can leave a bike lane buried in windrows.
- Post-storm timing: the municipality’s published target for clearing bike lanes after a snowfall. Compare the stated target with the city’s own reporting, not with general service promises.
| What to check | Where to look | What it tells you |
|---|---|---|
| Snow-clearing plan | City public works or transportation website | Whether bike lanes are named in the plan |
| Clearing sequence | Winter operations map or annual report | Whether lanes are cleared before or after arterials |
| Post-storm targets | Council or service-standard documents | The timeline the city commits to |
Once you have these three items for each city, compare them directly. A longer network with a vague clearing policy may be less usable in January than a shorter network with a named, funded winter-priority route.
Where to find municipal open data
Municipal cycling figures are rarely collected in one national register, so the practical starting point is each city’s own open data portal. Search it for datasets on cycling infrastructure or the bike network, then check whether the figures cover all bike lanes or only protected bike lanes, which are physically separated from traffic. The official sources consulted do not specify a single national register of protected lane lengths for Canadian cities, so cross-city comparisons often rely on city datasets combined with reports from research organisations and news outlets.
A published comparison shows what these figures look like. According to Georgia Straight, citing the Sightline Institute (2017), Vancouver had about 16 miles (≈26 km) of protected bike lanes in 2017, compared with the figures below for two US cities:
| City | Protected bike lanes (2017) |
|---|---|
| Vancouver | about 16 miles (≈26 km) |
| Seattle | 14 miles |
| Portland | 6 miles |
The same source gives Vancouver an area of 115 km² and states that this area places the city first for cycling infrastructure density.
To use such figures in your own comparison:
- Check the publication date. A 2017 count describes the network as it stood that year and is superseded by any newer dataset.
- Keep one unit. Sources mix miles and kilometres. Convert once and use the same unit for every city.
- Normalise by area. A raw length says little on its own. Divide lane length by city area: lane length ÷ city area. For Vancouver, 26 km ÷ 115 km² gives about 0.23 km of protected lane per km² (our calculation from the source values).
How does bike lane coverage affect choosing a neighbourhood?
City-wide totals are a starting point, not a neighbourhood ranking. In a 2017 comparison, the Georgia Straight, citing the Sightline Institute (2017), reported the following lengths of protected bike lanes:
| City | Protected bike lanes (2017) |
|---|---|
| Vancouver | About 16 miles (≈26 km) |
| Seattle | 14 miles |
| Portland | 6 miles |
The same source ranks Vancouver first for bike infrastructure density, given its area of 115 km². That ranking describes the city as a whole. It does not show whether a particular district has protected lanes on the streets residents actually use.
To apply this to a neighbourhood choice, work at a finer scale:
- Check the date. These figures are from 2017. Cycling networks change, so look for a current network map from the city before relying on any total.
- Separate protected from painted lanes. The source counts only protected lanes. A painted lane offers less separation from traffic, and a city total that mixes both types overstates the protected network.
- Map the lanes against your routes. List the trips you make most often, such as commuting, school runs and shopping, and check whether a protected lane covers the first and last few hundred metres of each.
- Compare neighbourhoods on the same basis. Use the same data source and the same definition for each candidate area, so the comparison is like for like.
Cycling coverage should be weighed alongside transit access, services and housing costs rather than treated as a deciding factor on its own.