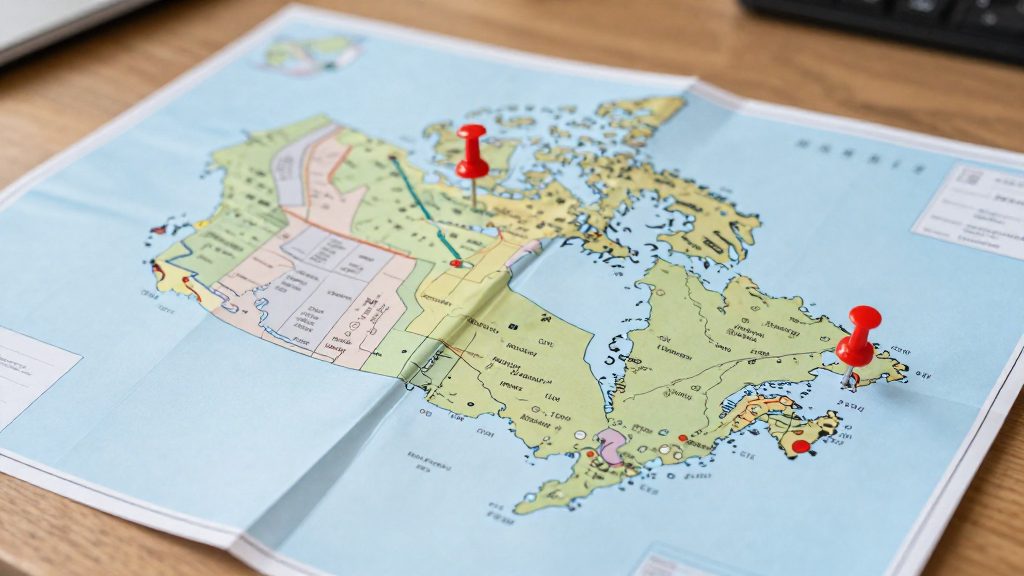
Grocery access in Canada is measured at the level of small census geographies, not by straight-line distance to a store. Statistics Canada’s grocery store proximity measure records how close each dissemination block is to another block containing a grocery store within 1 km walking distance, so the result reflects walkable access. Separately, the national Proximity Measures Database combines grocery stores with nine other services using a gravity model. Both tools are useful for comparing cities, but they answer slightly different questions.
How to measure grocery store access in Canada
Start with the two official resources and what each one covers:
| Resource | Publisher and date | What it provides |
|---|---|---|
| Grocery store proximity measure | Statistics Canada (2023) | Block-level walking access to a grocery store within 1 km; derived from total revenue of NAICS 4451 businesses in the Business Register |
| Proximity Measures Database | CMHC and Statistics Canada (April 2020) | Ten service measures, including grocery stores, at dissemination block level; about half a million records |
To compare two cities, follow these steps:
- Select the geography. Work at the dissemination block level in the Statistics Canada data viewer, not at the city or postal code level. Blocks are the unit the measure is calculated on.
- Read the colour class correctly. Map colours are assigned by quintile, so each class contains one fifth of the blocks in the dataset. A class tells you where a block ranks relative to others, not how many metres or minutes away the nearest store is.
- Cross-check with the Proximity Measures Database. Its gravity model weighs both distance and the size of each service, including services inside the reference block. Size is based on employment, revenue or number of access points, depending on the measure. Read the grocery figures alongside the other nine measures to see whether a neighbourhood is well served overall.
- Check for data gaps. CMHC notes that some geographies have gaps and expects the database to be revised as service geolocation data improves. If a comparison depends on a gap, state that limitation rather than filling it with an estimate.
The Proximity Measures Database
The Proximity Measures Database is a nationwide dataset that CMHC and Statistics Canada released in April 2020. It measures how close residents live to ten types of services: employment, grocery stores, pharmacies, health care, child care, primary education, secondary education, public transit, neighbourhood parks and libraries. It contains about half a million records at the dissemination block level (CMHC, 2020).
The database uses a gravity model. It weighs the distance to each service against the size of that service, and it includes services located inside the reference block itself. Size depends on the measure: employment, revenue or number of access points (CMHC, 2020).
The grocery store measure is the tool in this family that addresses grocery access specifically. It is derived from the total revenue of all NAICS 4451 businesses in the Business Register, and it gauges how close each dissemination block is to any block that contains a grocery store within 1 km walking distance (Statistics Canada, 2023).
| Parameter | Grocery store measure |
|---|---|
| Unit of analysis | Dissemination block |
| Distance threshold | 1 km walking distance |
| Size input | Total revenue of NAICS 4451 businesses |
| Map classes | Quintiles (five equal-sized groups) |
To compare two cities, open the Statistics Canada data viewer, select the grocery store measure, and check the share of blocks in each city that fall into the highest and lowest classes. Then review the study area for data gaps. CMHC notes that some geographies have gaps and that it expects the database to be revised as service geolocation data improves (CMHC, 2020). The official sources consulted do not specify the revision schedule.
Walking 1 km: what does the indicator measure?
Statistics Canada’s grocery store proximity measure answers one question: how close is a given area to a dissemination block that contains a grocery store reachable within 1 km on foot? It does not count stores or report travel times. It is a relative score for each block. The measure is derived from the total revenue of all NAICS 4451 businesses in the Business Register, so the input is economic activity rather than a count of storefronts. According to Statistics Canada (2023-09-12), this is the basis for the data viewer’s results.
The unit of analysis is the dissemination block, which is the smallest geography in the data viewer. Each block receives a value, and the map colours those values by quintile. Each colour class holds one fifth of the blocks, so the classes show rank order within the dataset, not fixed distances. Two blocks in the same colour class can be at quite different distances from a store, and a block in a neighbouring class is not necessarily much farther away. Statistics Canada (2023-09-12) describes the classes in these terms.
The measure belongs to a wider family. CMHC and Statistics Canada released the Proximity Measures Database in April 2020, covering ten measures, including grocery stores, and containing about half a million records at the dissemination block level (CMHC, 2020-04-17). The grocery measure is calculated with a gravity model, which weighs the distance to services against their size. Size is taken from employment, revenue or the number of access points, depending on the measure. For groceries, the size input is revenue. Services inside the reference block are included in the calculation.
| Element | What the official sources state |
|---|---|
| Walking threshold | Grocery store within 1 km walking distance |
| Unit of analysis | Dissemination block |
| Input for grocery measure | Total revenue of NAICS 4451 businesses (Business Register) |
| Colour classes | Quintiles, one fifth of the data each |
| Method | Gravity model, distance weighted by size |
| Known limitation | Data gaps in some geographies; revisions expected as geolocation data improves (CMHC, 2020-04-17) |
Because the revenue input and the gap caveat both affect results, a block showing a high proximity score should be checked against the local store list before drawing conclusions about a specific neighbourhood. The official sources consulted do not specify how gaps are distributed between cities, so comparisons across Canadian cities should note that coverage may vary.
Comparing large cities and small towns: what the grocery measure can and cannot show
The official sources consulted do not give a national figure that ranks large cities against small towns for grocery access. The usable measure is Statistics Canada’s grocery store proximity indicator, which scores each dissemination block by how close it is to a block with a grocery store within 1 km walking distance. Because the score is about walking distance, the answer depends on how stores are spread within each place, not only on population size.
What the grocery measure captures
- Unit of analysis: the dissemination block, the smallest geography in the data viewer.
- Threshold: a block is scored on whether a grocery store is reachable within 1 km on foot.
- Input: the score is derived from total revenue of all NAICS 4451 businesses in the Business Register, so it reflects where grocery retail activity is concentrated.
- Map classes: colours are assigned by quintile, so each class holds one fifth of the data. A colour shows a block’s rank within the dataset, not an absolute level of service.
Parameters for comparing places
| Element | What it tells you | Source and date |
|---|---|---|
| Dissemination block | Smallest unit, allows neighbourhood-level comparison | Statistics Canada (2023-09-12) |
| 1 km walking distance | Access threshold for the grocery measure | Statistics Canada (2023-09-12) |
| Quintile classes | Relative ranking, one fifth of blocks per class | Statistics Canada (2023-09-12) |
| Gravity model | Weighs distance and service size, including services inside the block | CMHC (2020-04-17) |
| About half a million records | Scale of the Proximity Measures Database at block level | CMHC (2020-04-17) |
How to run the comparison
- Pull the grocery measure for every block in each municipality you want to compare.
- Compare the share of blocks in the top quintiles, not individual colours across maps.
- Look at blocks in outlying areas separately, since low-density blocks can sit farther than 1 km from a store.
- Check for data gaps. CMHC warns that some geographies have gaps and expects revisions as service geolocation improves.

Dense service neighbourhoods: what the grocery measure captures
In Canadian data, a “dense” neighbourhood for grocery access is a measured result, not a visual impression. Statistics Canada’s grocery store proximity measure checks how close each dissemination block (the agency’s small geographic unit) is to any dissemination block that contains a grocery store within 1 km walking distance. The closer a block is to a store, the higher its proximity rating.
The measure is built from business data, not a simple store count. It is derived from the total revenue of all businesses classified under NAICS 4451 in the Statistics Canada Business Register (Statistics Canada, 2023). Revenue weighting means that the scale of the retail activity matters, not only whether a store exists.
Results are shown as quintile classes. Each class holds one-fifth of the blocks, so a block’s colour reflects its rank within the dataset, not a fixed walking time or an absolute standard. Two cities can therefore look different on a map even when their blocks sit at similar distances from a store.
The grocery measure is one of ten in the Proximity Measures Database, released by CMHC and Statistics Canada in April 2020 (CMHC, 2020). The database uses a gravity model that weighs distance to services and the size of those services, including services located inside the reference block itself.
When comparing cities, use the following checks:
- Compare the share of blocks in each class across cities, not the colour of a single block.
- Check whether a city’s blocks have data gaps, which CMHC notes for some geographies (CMHC, 2020).
- Expect possible revisions, since CMHC anticipates updating the database as service geolocation data improves (CMHC, 2020).
What are the limits of the data?
The Statistics Canada grocery store proximity measure answers one narrow question: how close a dissemination block is to another block with a grocery store within 1 km walking distance. It does not directly count stores or report their physical size, since it relies on business revenue as a proxy for the scale of grocery activity. It does not assess prices, product range, or opening hours. Because the measure is derived from the total revenue of all NAICS 4451 businesses in the Business Register, a block’s score reflects economic activity, not the number of shops a resident can physically reach. Treating it as a direct index of food access would overstate what it shows.
Limits by component
| Element | What it means when comparing cities |
|---|---|
| Revenue-based input | Scores come from business revenue, so two blocks with similar scores may have very different numbers of stores. |
| 1 km walking distance | The threshold is fixed at 1 km walking distance. It does not reflect the mobility of individual residents. |
| Quintile classes | Each colour class holds a fifth of the data viewed, so classes are relative ranks, not absolute service levels. |
| Block-level granularity | Results are shown per dissemination block, so averages for a whole city or neighbourhood hide variation within them. |
Model and data gaps
The wider Proximity Measures Database, published by CMHC and Statistics Canada in April 2020, uses a gravity model. It weighs distance to services against their size, and includes services located inside the reference block. Size is based on employment, revenue, or number of access points depending on the measure, so scores for different measures are not directly interchangeable.
CMHC notes that some geographies have data gaps and expects the database to be revised as service geolocation data improves. The official sources consulted do not specify which geographies are affected, so check coverage for your city before drawing conclusions. Scores may change between releases, and comparisons across editions should be treated with caution.
How to compare two cities before moving?
Comparing grocery access between Canadian cities works best at the neighbourhood level, because city averages hide large differences within a single municipality. Statistics Canada’s grocery store proximity measure scores each dissemination block by how close it is to another block containing a grocery store within 1 km walking distance, according to Statistics Canada (2023-09-12). Comparing blocks rather than whole cities shows whether a downtown core and a suburban fringe have similar access.
To run the comparison:
- Define the areas. Pick the specific neighbourhoods or blocks you would realistically live in, not the city as a whole.
- Pull the grocery score for each area. Use the Statistics Canada data viewer, which reports results at the dissemination block level.
- Read the map colours carefully. Colours are assigned by quintile, so each class holds one fifth of the data. A block in the top class is in the best-served fifth of the dataset, not within a fixed distance of a store.
- Add context from the wider database. The CMHC and Statistics Canada Proximity Measures Database, released in April 2020, covers ten measures at block level: employment, grocery stores, pharmacies, health care, child care, primary education, secondary education, public transit, neighbourhood parks and libraries, according to CMHC (2020-04-17). Comparing grocery scores alongside transit and pharmacy scores shows whether an area is strong across services or only in one.
- Check the method. CMHC describes a gravity model that weighs distance to services and their size, including services inside the reference block, according to CMHC (2020-04-17). Size is measured by employment, revenue or access points depending on the measure. A high score therefore reflects both proximity and the scale of nearby services.
Frequently asked questions
Can I use the grocery store measure to rank Canadian cities by food access?
No. The official sources consulted do not publish city-level grocery results, so no city ranking can be derived from them. You can compare neighbourhoods within one area by working at the dissemination block level in the Statistics Canada data viewer.
What do the map colours tell me about a neighbourhood?
Each colour is a quintile class, which shows where a block ranks against the other blocks in the current view. Each class holds one fifth of the blocks, but the official sources consulted do not specify whether the cut-offs apply nationally. A colour therefore does not tell you how many metres or minutes away the nearest store is.
What does the grocery store measure leave out?
It does not directly count stores or report their physical size, because it uses business revenue from NAICS 4451 grocery businesses as a proxy for the scale of grocery activity. It also does not assess prices, product range or opening hours. Its fixed 1 km walking threshold does not reflect how individual residents actually travel.